Duet3: Tool Coordinates N/A in DWC
-
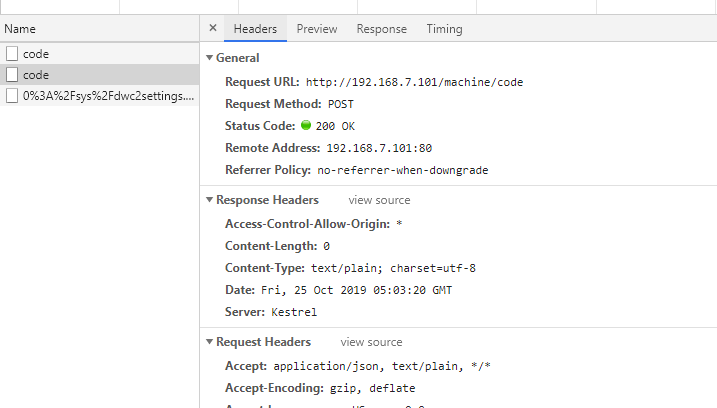
I've done a few network traces with the Chrome developers console. I do not ever see DWC2 attempting to fetch any form of status.
I do see all commands DWC2 issues. Movement, homing, etc. I do not see any responses to these commands, no payload returned. Therefore, they cannot be returning a status to be parsed.
Typical examples, G1 commands: (Also, this shows DWC2 saving the settings file, which it seems to do quite a bit, even when no settings change).

And a double click into one of the command ("code") network events:

Same event, no response:

And the remainder of the console shows nothing, even though DWC2 is/was connected for over an hour with this console open. No status requests.
-
And here is the settings payload, in case it helps:
{"main":{"language":"en","lastHostname":"192.168.7.101","darkTheme":true,"useBinaryPrefix":true,"disableAutoComplete":false,"settingsStorageLocal":false,"settingsSaveDelay":2000,"cacheStorageLocal":false,"cacheSaveDelay":4000,"notifications":{"errorsPersistent":false,"timeout":5000},"webcam":{"url":"","updateInterval":5000,"useFix":false,"embedded":false,"rotation":0,"flip":"none"}},"machine":{"ajaxRetries":2,"updateInterval":250,"extendedUpdateEvery":20,"fileTransferRetryThreshold":358400,"crcUploads":true,"pingInterval":2000,"babystepAmount":0.05,"codes":["M109","M905","M999","M119","G0 X300Y300","G53 G0 X12 Y312 F6000","G53 G1 Y355 F600","G1 Y318 F600","G0 X150 Y150 F10000","G2 I40","G2 I40 F8000","G53 G0 X16 Y320 F10000","G53 G0 X289 Y320 F10000","G53 G1 Y364 F10000","G53 G1 Y374 F10000","G53 G1 Y384 F10000","G53 G1 Y300 F10000","G53 G1 Y375 F10000","G53 G1 Y355 F10000","G53 G1 Y345 F10000","G1 Y355 F10000","G1 Y375 F10000","G1 Y345 F10000","G53 G1 Y360 F10000","G53 G1 Y345 F6000","G53 G0 X12 Y320 F10000","G53 G0 X285 Y320 F10000","M408 S2","T0","T-1","M584 E6:7:8:9","M584","T-9","M950 S0 C\"io7.out\"","M280 P0 S1500 I1","M280 P0 S1100 I1","G0 Y300 F1","G0 Y300 F10","G0 Y300 F100","G0 X50","G0 X100","G0 Y 250 F100","G0 Y 250 F1000","G0 X 250 F1000","G0 X 100 F1000","G1 X50 F1000","G1 X250 F1000","G1 X150 F1000"],"displayedExtraTemperatures":[],"displayedExtruders":[0,1],"displayedFans":[-1],"moveSteps":{"X":[100,50,10,1,0.1],"Y":[100,50,10,1,0.1],"Z":[50,25,5,0.5,0.05],"default":[100,50,10,1,0.1]},"moveFeedrate":6000,"extruderAmounts":[100,50,20,10,5,1],"extruderFeedrates":[60,30,15,5,1],"temperatures":{"tool":{"active":[250,235,220,205,195,160,120,100,0],"standby":[210,180,160,140,0]},"bed":{"active":[110,100,90,70,65,60,0],"standby":[40,30,0]},"chamber":[90,80,70,60,50,40,0]},"spindleRPM":[10000,75000,5000,2500,1000,0]}} -
Are you running the Duet 3 in standalone mode or with an attached RPi?
-
@dc42 said in Duet3: Tool Coordinates N/A in DWC:
Are you running the Duet 3 in standalone mode or with an attached RPi?
RPI, specifically a 4, running an image downloaded from the "SBC setup" instructions in the Dozuki. Both firmware and DWC have been updated (multiple times) beyond the original image, via the DWC system upload dialog.
The captures/traces are from a Chrome browser on a Windows 10 machine, with a URL that points to the Pi.
I can, if it helps debug, VNC into the Pi and run a browser on the Pi desktop.
-
We've alerted chrishamm to this thread because we suspect a DWC or DSF issue, given that M408 S2 reports the coordinates.
-
Further data points:
I git cloned the DWC repository; did an npm install, followed by an npm build and uploaded the resulting sbc zip via DWC system dialog.
After these actions I DO see an always open connection called "machine" (that I was not seeing before). I see an interchange every half second or so. However, the display is still all "n/a"
The payload in these machine interchanges typically looks like:
{"electronics":{"vIn":{"current":24.4},"mcuTemp":{"current":47.5}}}If I execute a move of X, there are more fields, indicating the coordinates have changed.
{"electronics":{"vIn":{"current":24.4}},"move":{"axes":[{},{"machinePosition":10.0},{},{}],"currentMove":{"requestedSpeed":0.0,"topSpeed":0.0}},"state":{"status":"idle"}}And last, a G1 that moved both X and Y:
{"electronics":{"mcuTemp":{"current":47.4}},"move":{"axes":[{"machinePosition":50.0},{"machinePosition":50.0},{},{}],"currentMove":{"requestedSpeed":0.0,"topSpeed":0.0}},"state":{"status":"idle"}}Hope this helps...
Danal
-
And... it seems that Chrome developer console network must be already recording when a web socket opens... otherwise it does not see it at all.
That explains why I was sometimes seeing the ws://.........../machine socket, and sometimes not. It has nothing to do with git clones, or any other method of getting the build onto the SBC. It is only dependent on starting recording before a reload (and thus before the open of that socket).
-
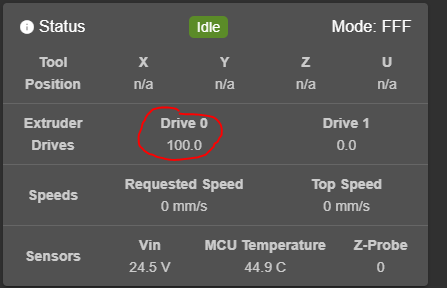
Recently wired the first extruder on the printer that has the Duet 3. Position for it is being reported correctly.

-
I'm sorry but I haven't had a chance to look further into this yet. It looks like the drive position isn't properly set in the DSF object model and I suspect the key to that is the status response returned from RRF.
Can you post the output of "M408 S2"?
PS: If you're running DWC2 via npm, I can recommend installing the VueJS dev tools. With that addon you can look into the model data behind the UI (Vuex).
-
No prob on the "busy"... I perfectly understand.
@chrishamm said in Duet3: Tool Coordinates N/A in DWC:
PS: If you're running DWC2 via npm, I can recommend installing the VueJS dev tools. With that addon you can look into the model data behind the UI (Vuex).
OOOHHH!!! NICE!!! Thank you!
And... M408:
M408 S2 {"status":"I","coords":{"axesHomed":[1,1,1,1],"wpl":1,"xyz":[12.000,280.000,0.050,0.000],"machine":[12.000,280.000,7.900,0.000],"extr":[0.0,0.0]},"speeds":{"requested":0.0,"top":0.0},"currentTool":-1,"params":{"atxPower":-1,"fanPercent":[0,0,-100,-100,-100,-100,-100,-100,-100,-100,100,100],"speedFactor":100.0,"extrFactors":[100.0,100.0],"babystep":0.000},"sensors":{"probeValue":0,"fanRPM":[-1,-1,-1,-1,-1,-1,-1,-1,-1,-1,-1,-1]},"temps":{"bed":{"current":18.5,"active":0.0,"standby":0.0,"state":0,"heater":0},"current":[18.5,22.4,22.4],"state":[0,0,0],"tools":{"active":[[0.0],[0.0]],"standby":[[0.0],[0.0]]},"extra":[{"name":"*Bed","temp":18.5},{"name":"*Ex0","temp":22.4},{"name":"*Ex1","temp":22.4}]},"time":44222.0} -
Also, if it helps, I modified a bit of code to log position to the chrome developer console, so that I could continue to commision a new printer with Duet 3. I believe the following proves that basic JSON parsing of the socket output of the Duet3-to-DWC2 is working down in the connector itself. I did not attempt to trace any further through the code, so I don't know where the eventual disconnect occurs.
The "console.log" statements added to this spot in the code:
                          case 6:
                            // Process model updates
                            data = JSON.parse(e.data); // Deal with generic messages
                if (data.move) {
                if (data.move.drives) {
                        {console.log("X",data.move.drives[0]);}
                        {console.log("Y",data.move.drives[1]);}
                        {console.log("Z",data.move.drives[2]);}
                }
                }

                            if (data.messages) {
                              data.messages.forEach(
Produce output like this:
app.fee4fdb1.js:139868 Y {position: 86} app.fee4fdb1.js:139869 Z {} app.fee4fdb1.js:139867 X {} app.fee4fdb1.js:139868 Y {position: 36} app.fee4fdb1.js:139869 Z {} app.fee4fdb1.js:139867 X {} app.fee4fdb1.js:139868 Y {position: -10.7} app.fee4fdb1.js:139869 Z {} app.fee4fdb1.js:139867 X {} app.fee4fdb1.js:139868 Y {position: -0.7} app.fee4fdb1.js:139869 Z {} app.fee4fdb1.js:139867 X {position: 13.1} app.fee4fdb1.js:139868 Y {position: 354.3} app.fee4fdb1.js:139869 Z {position: 5.05} app.fee4fdb1.js:139867 X {} app.fee4fdb1.js:139868 Y {} app.fee4fdb1.js:139869 Z {} app.fee4fdb1.js:139867 X {} app.fee4fdb1.js:139868 Y {position: 279.3} app.fee4fdb1.js:139869 Z {} app.fee4fdb1.js:139867 X {position: 12} app.fee4fdb1.js:139868 Y {position: 280} app.fee4fdb1.js:139869 Z {position: 0.05} -
Well... very interesting. It suddenly started working.
I am not 100% sure, but the thing that changed seems to be moving to Beta12 firmware.