Duet3D Logo Duet3D
    • Tags
    • Documentation
    • Order
    • Register
    • Login

    Scale Layer Chart by Shown Data, Only

    Scheduled Pinned Locked Moved
    Duet Web Control wishlist
    1
    1
    140
    Loading More Posts
    • Oldest to Newest
    • Newest to Oldest
    • Most Votes
    Reply
    • Reply as topic
    Log in to reply
    This topic has been deleted. Only users with topic management privileges can see it.
    • tfjieldundefined
      tfjield
      last edited by

      Currently, the layer chart scales the Y axis by all the layer times:

      27f04b1f-5a58-4690-91d0-ed264073cd05-image.png

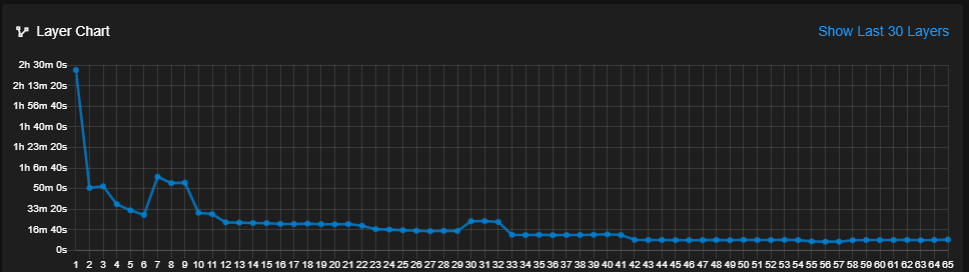
      But when showing only the last 30 layers, the Y axis stays the same:

      52f37d32-b61b-4852-b587-5da1aee06257-image.png

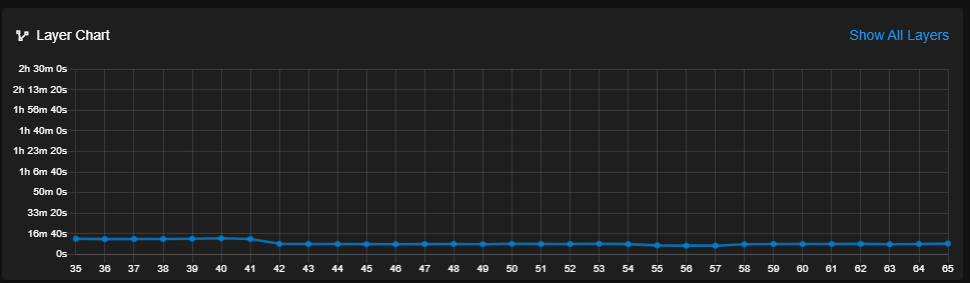
      When subsequent layers are much faster than the layers before, the graph loses it's value, since all the points are clustered near the bottom.

      My request is to adjust the Y axis based on the shown data, only.

      1 Reply Last reply Reply Quote 2
      • First post
        Last post
      Unless otherwise noted, all forum content is licensed under CC-BY-SA