Btn_Cmd wrong scale in chart
-
I think, thats one for @MintyTrebor
I've designed a chart in Btn_Cmd which displays different values of my water cooling system.
I found, that a scale setting of a value is not displayed correctly.The y-axle of my chart is set to show the water-temp in a range 0-50. All other parameters are scaled in the settings to suit in this range.
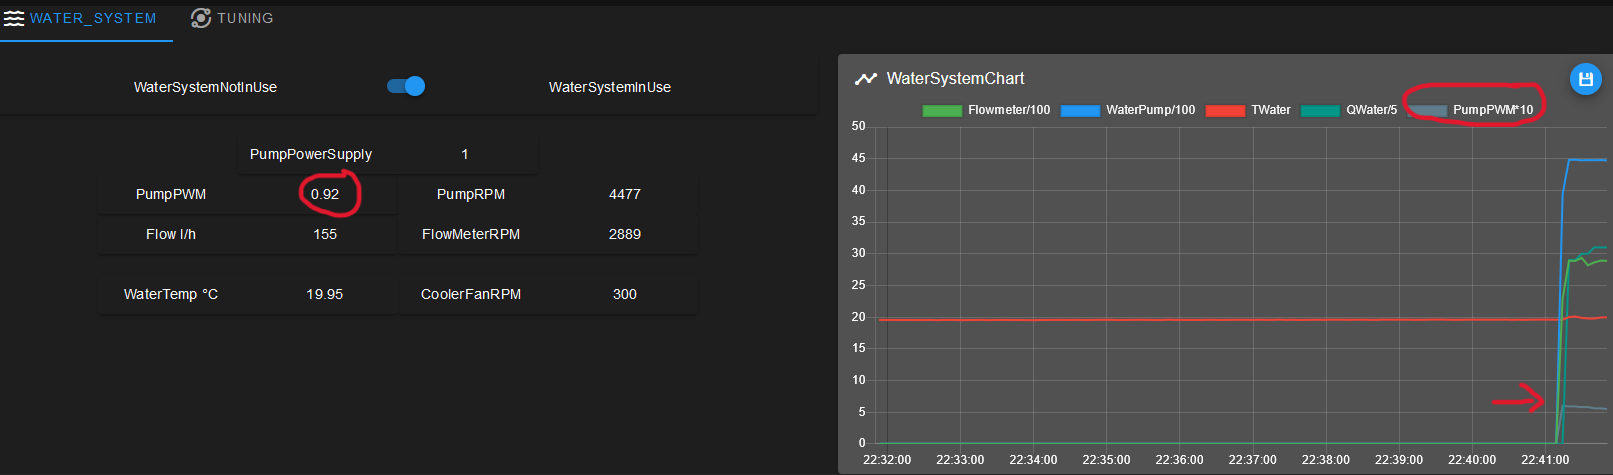
One of the other parameters is the pump-PWM. To suit in the chart, it is multiplied by 10. But it isn't correctly displayed in the chart!On the first picture, you see the pump-PWM in decimals and in the chart:
- pump-PWM = 0.92
- the grey graph in the chart should be at 9.2 (0.92 x 10) in the chart. But it is a bit higher than 5
The second picture a bit later, same "problem"
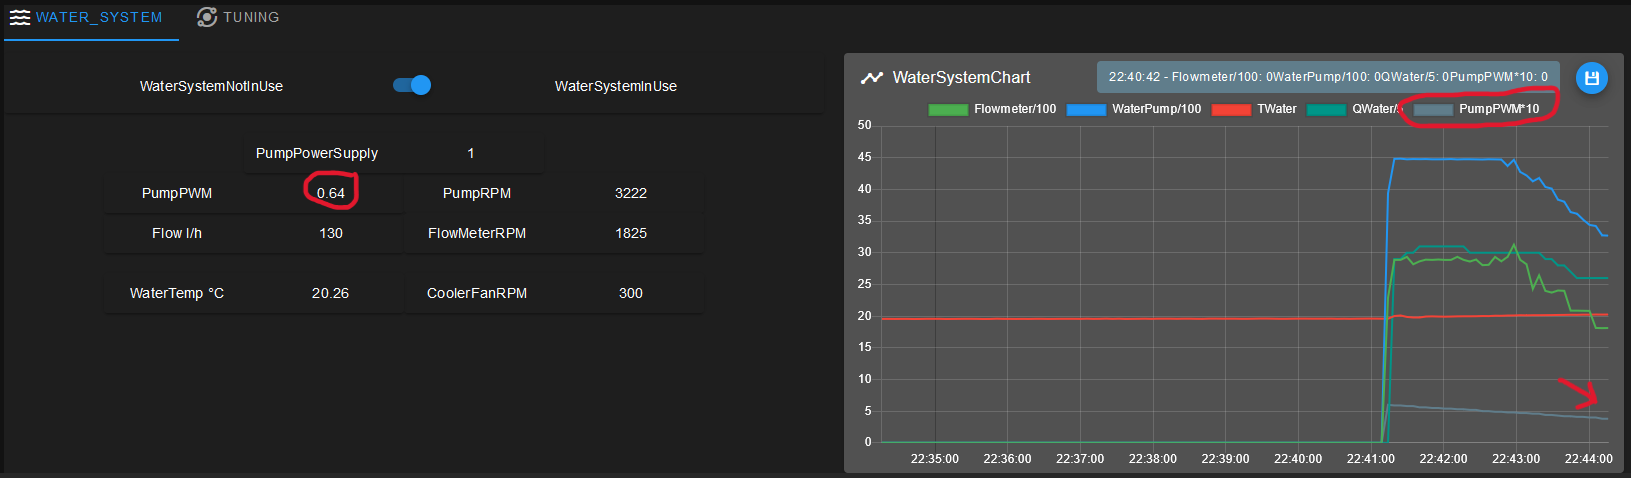
All other graphs are scaled correctly. Perhaps there is something wrong with PWM values? Or the "restriction" in my config.g for that pump-PWM can also be the problem.
For better control of the pump, i've limited the min and max speed with the L and X parameter of the M106 command:M106 P3 C"WaterPump" S0 L0.3 X0.6 B2 H-1 R1It could be, that the graph is showing the "real" PWM value. Not the "restricted" one?
-
 undefined cosmowave marked this topic as a question
-
@cosmowave Can you show me the value displayed in the object model browser please, and also show me the line config in the custom chart config panel please..
From the second picture it looks like the object is an array - is this correct?
-
@MintyTrebor
Thanks for your answer. The value in the red circle (left hand side in the picture) is the value from the OM. But i will show you a picture from the "real" OM browser when i'm at home today evening...
No, the object isn't an array. I don't use arrays until now. -
@MintyTrebor
I'm very sorry! It was my fault...
The graph was not showing the same value as the numeric panel!
Whats the difference between requestedValue and actualValue? Is the actualValue the "real" PWM inside the min and max settings?EDIT: Now i need a RRF3.5.3 version...
It's funny... first, one layout was not working because the missing retraction parameters in OM (RRF5.3.2). Now, with 3.5.3 the plugin itself is not working anymore..