RRF3 and dual sensors for heat bed
-
It seems that I have had good luck sorting out my migration to RRF3 only two issues remain. I have not been able to get the BLTouch to work but that needs some more digging before I ask for help.
The second issue, I have two thermistors on my heat bed, one to actually get and control the temperature with and one that I would just like to display on the temperature graph.
I use the following to specify the sensors (and heaters):; Heaters
M308 S0 P"bedtemp" Y"thermistor" T100000 B3950 ; configure sensor 0 as thermistor on pin bedtemp
M308 S0 P"e2temp" Y"thermistor" T100000 B3950 ; configure alternate or second bed heat sensor
M950 H0 C"bedheat" T0 ; create bed heater output on bedheat and map it to sensor 0
M143 H0 S120 ; set temperature limit for heater 0 to 120C
M307 H0 B0 S1.00 ; disable bang-bang mode for the nozzle heater and set PWM limit
M308 S1 P"e0temp" Y"thermistor" T100000 B3950 ; configure sensor 1 as thermistor on pin e0temp
M950 H1 C"e0heat" T1 ; create nozzle heater output on e0heat and map it to sensor 1
M143 H1 S280 ; set temperature limit for heater 1 to 280C
M307 H1 B0 S0.6 ; disable bang-bang mode for the nozzle heater and set PWM limit
M308 S2 P"e1temp" Y"thermistor" T100000 B3950 ; configure sensor 2 as thermistor on pin e0temp
M950 H2 C"e1heat" T2 ; create nozzle heater output on e0heat and map it to sensor 2
M143 H2 S280 ; set temperature limit for heater 2 to 280C
M307 H2 B0 S0.6 ; disable bang-bang mode for the nozzle heater and set PWM limitI question the S0 on line 1 and line 2 - should they be different sensors ?
I tried to make line 2 S3 instead of S0 but that didn't result in a line on the temperature graph.
How do I display the second sensor on the temperature graph -
Never mind, sorted it out. Kinda non-intuitive but it turns out you have to give a name (A parameter in M308) to the sensor and then you can go to the 'extra' tab in the heaters in the web interface and select to display the graph.
-
<sigh> Ok, so I named the two sensors 'test1' and 'test2' to see if they would show up .... and they did. Now, no matter what I name them, the graph always names them test1 and test2. The name reflects properly under tools extra but is not re-named to the new name in the graph. Bug ? or do I need a magic incantation ?
-
When saving the config.g file, the system asks you if you want to restart Duet. When you answer 'yes' it does a reset but it doesn't clear the name of the graph in the chart window that was changed. Instead, a refresh of the web page is required to reset the name to the name that is specified in config.g
In other words, it's a bug. -
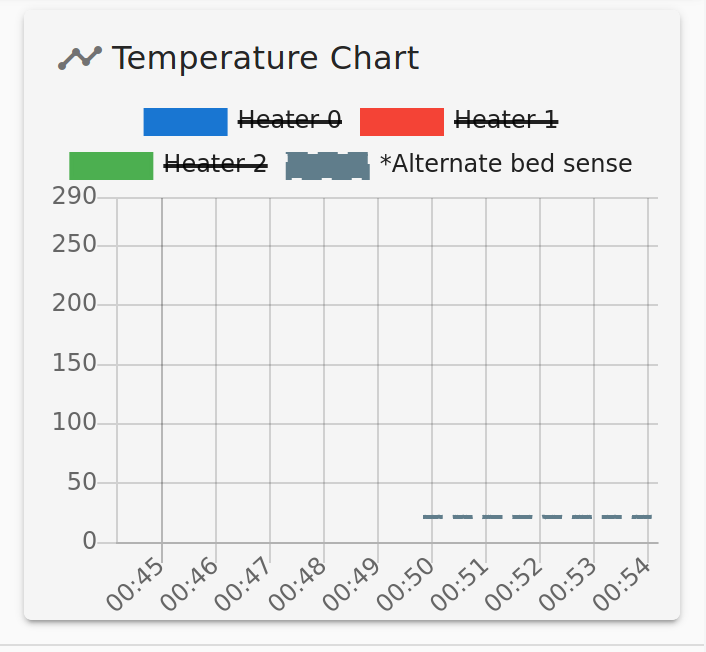
While I am talking to myself here and reporting bugs .... the temperature chart shows a dashed line for the extra sensor but the legend on the graph shows some weird thing that might have some relation to a dashed line before it fell into a pot of chocolate and
 had to eat it's way out of it getting real fat in the process (sorry, that's the only way that I can describe it)