Bltouch not always triggering during bed probe
-
Our bltouch started randomly stopping mid probe. Sometimes its on the first probe, sometimes later but it never finishes the entire bed anymore. Also sometimes its seems to lag between probe moves occasionally. The probe used work but seems to have slowly gotten worse over time to where now its 50/50 whether the pin will retract or not.
I'm guessing it may be a wiring issues or something with the probe itself? Its fairly large printer with a long run for the cable from the hotend to the mainboard, could interference be a problem?
; Z-Probe
M950 S0 C"exp.heater3"                                            ; create servo pin 0 for BLTouch
M558 P9 C"^zprobe.in" H5 F200 R0.2 T15000        ; set Z probe type to bltouch and the dive height + speeds
G31 P25 X-14.9 Y-30.5 Z0.9                                        ; set Z probe trigger value, offset and trigger height
M557 X0:335 Y0:300 P4                                             ; define mesh grid
M376 H10                                                                     ; Set bed compensation taper
I have a video of the problem but not enough reputation to posy it yet.
-
@emofes I've given you some reputation, so you can now post links.
Is the BLTouch in a heated chamber? They are quite susceptible to heat, which causes them to fail. Otherwise, check the wiring for loose connections. It's also possible that the wires have fatigued with the motion of the printer, and need to be replaced.
Ian
Bed-slinger - Mini5+ WiFi/1LC | RRP Fisher v1 - D2 WiFi | Polargraph - D2 WiFi | TronXY X5S - 6HC/Roto | CNC router - 6HC | Tractus3D T1250 - D2 Eth
-
@droftarts its on old Fusion3 F410. The chamber is not actively heated but the printer is enclosed and we sometimes times run the bed up to 100°C. It doesn't have issues resetting the probe or running the stow, deploy, or self test commands. I will check the wiring connections today.
-
@emofes From your video, I'd say the issue was with the probe. The Z seems to stop when the probe is triggered, and the probe retracts on the first three probe attempts. On the third probe, there does seem to be a delay before probe moves on. On the fourth probe, the Z stops when the probe is triggered, but the pin doesn't retract, and the probe goes into fault mode. I think the pin is probably sticking, or needs adjustment. From this page: https://www.3dprintbeast.com/bltouch-blinking-red/
The BLTouch can blink red in two different patterns, where the blinking is fast in one (50% uptime of the LED) and slow in the other (80% uptime of the LED), with each pattern signaling a separate issue.
I'd say the error pattern is the first pattern. While it says this happens during self-test, it also happens during operation.
BLTouch Blinking Red Quickly
The first BLTouch red LED pattern that signifies an error is when the LED flashes quickly with an uptime of 50%.
A quickly flashing red LED on the BLTouch tells us that the BLTouch is in alarm mode due to failing the self-test process where the probe conducts the necessary checks before becoming ready.
As the BLTouch going into alarm mode can be a result of many different things that go wrong during the self-test process, here is a list of the common culprits that accommodate most cases but isn’t exhaustive:
- Obstruction of the pin, causing it to be incapable of moving up and down freely, which can be due to either internal factors (damaged probe) or external factors (dust, dirt, etc.)
- The pin hitting the build plate
- Issues with the homing of the Z-axis, such as the speed being too slow
- Physical damage to the probe, preventing the pin from functioning correctly
- Firmware issues
- Defective probe
While this list isn’t exhaustive by any means, as we have mentioned, it should give you a good idea of why the probe can go into alarm mode.
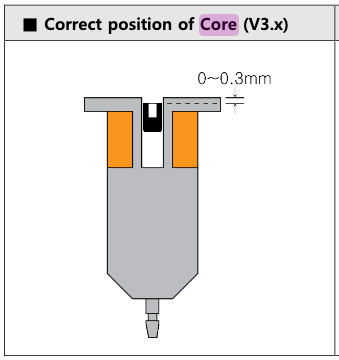
You can also adjust the 'core'. There isn't much explanation about what this does, though. See https://www.antclabs.com/_files/ugd/f5a1c8_d40d077cf5c24918bd25b6524f649f11.pdf
If push-pin deploy fails, turn the core by up to 180 degrees with an Allen-key so that the core is further inside the casing.
Perhaps if the opposite is true, ie fails to retract, unscrew the core 180 degrees so it is nearer the top.
Ian
Bed-slinger - Mini5+ WiFi/1LC | RRP Fisher v1 - D2 WiFi | Polargraph - D2 WiFi | TronXY X5S - 6HC/Roto | CNC router - 6HC | Tractus3D T1250 - D2 Eth
-
@droftarts Thanks Ian, I will mess with the pin and see if that does anything. I also have a cr touch and knockoff bltouch at home I can test out or swap the pins from.
-
@droftarts
I did some more testing, and it seems like the issue might be a symptom of a bigger problem related to DWC or the printers network connection. The printer is running a Duet 2 Ethernet board connected via Ethernet to a router that is not connected to the internet, just this printer, a Bambu printer in LAN mode, and some Hue lights.When the printer is connected to the router, it usually fails to finish probing and randomly lags between moves, like in the video I posted earlier. Also, when I connect to the printer’s browser interface, it will randomly disconnect and reconnect. This seems to happen more frequently if I use Safari on an iPad versus Firefox on a Windows machine, but it occurs on both.
If I disconnect the printer from Ethernet, it seems to probe and print fine, no lagging or failed probe points.
A few things I'm wondering:
-
Are there any commonly known issues that would cause frequent network disconnects?
-
The controller is in an enclosure, and the Ethernet cable runs over the power supply; could there be an interference issue?
-
The Ethernet cable connects to a coupler so that another Ethernet cable can be connected outside the enclosure. Maybe the coupler or one of the cables is bad and causing random disconnects?
-
Could a problem with DWC or the Ethernet connection be causing interrupts?
-
Could using input shaping, mesh bed leveling, DWC, etc. be too much for the board to handle at once?
-
-
@emofes What firmware are you running? Send M122 and post the results.
I would think that there's something on the network that is generating a lot of traffic. You could try doing a WireShark trace. Or disconnect other devices, and see it there's one that's causing the issue.
Ian
Bed-slinger - Mini5+ WiFi/1LC | RRP Fisher v1 - D2 WiFi | Polargraph - D2 WiFi | TronXY X5S - 6HC/Roto | CNC router - 6HC | Tractus3D T1250 - D2 Eth
-
m122 === Diagnostics === RepRapFirmware for Duet 2 WiFi/Ethernet version 3.5.4 (2024-11-24 10:43:42) running on Duet Ethernet 1.02 or later Board ID: 0JD0M-9P6B2-NJ4S4-6JTDL-3S46R-KS0AM Used output buffers: 6 of 26 (24 max) === RTOS === Static ram: 23488 Dynamic ram: 68672 of which 208 recycled Never used RAM 17200, free system stack 108 words Tasks: NETWORK(1,ready,15.4%,181) HEAT(3,nWait 5,0.1%,307) Move(4,nWait 5,3.5%,268) MAIN(1,running,81.0%,742) IDLE(0,ready,0.0%,29), total 100.0% Owned mutexes: === Platform === Last reset 06:53:31 ago, cause: reset button or watchdog Last software reset at 2025-04-26 13:54, reason: User, Gcodes spinning, available RAM 16940, slot 1 Software reset code 0x0003 HFSR 0x00000000 CFSR 0x00000000 ICSR 0x0041f000 BFAR 0xe000ed38 SP 0x00000000 Task MAIN Freestk 0 n/a Error status: 0x00 Aux0 errors 0,1,0 MCU temperature: min 34.8, current 36.7, max 38.6 Supply voltage: min 23.0, current 23.4, max 23.6, under voltage events: 0, over voltage events: 0, power good: yes Heap OK, handles allocated/used 99/0, heap memory allocated/used/recyclable 2048/300/300, gc cycles 0 Events: 0 queued, 0 completed Driver 0: standstill, SG min 0 Driver 1: standstill, SG min 0 Driver 2: standstill, SG min 0 Driver 3: standstill, SG min 0 Driver 4: standstill, SG min n/a Driver 5: Driver 6: Driver 7: Driver 8: Driver 9: Driver 10: Driver 11: Date/time: 2025-04-29 14:48:45 Cache data hit count 4294967295 Slowest loop: 1851.79ms; fastest: 0.15ms I2C nak errors 0, send timeouts 0, receive timeouts 0, finishTimeouts 0, resets 0 === Storage === Free file entries: 10 SD card 0 detected, interface speed: 20.0MBytes/sec SD card longest read time 250.0ms, write time 2.1ms, max retries 0 === Move === DMs created 83, segments created 44, maxWait 56969ms, bed compensation in use: mesh, height map offset 0.000, max steps late 0, min interval 0, bad calcs 0, ebfmin -0.00, ebfmax 1.00 no step interrupt scheduled Moves shaped first try 29505, on retry 6213, too short 24299, wrong shape 702764, maybepossible 1420 === DDARing 0 === Scheduled moves 824009, completed 824009, hiccups 0, stepErrors 0, LaErrors 0, Underruns [0, 0, 0], CDDA state -1 === Heat === Bed heaters 0 -1 -1 -1, chamber heaters -1 -1 -1 -1, ordering errs 0 Heater 0 is on, I-accum = 0.0 === GCodes === Movement locks held by null HTTP is idle in state(s) 0 Telnet is idle in state(s) 0 File is idle in state(s) 0 USB is idle in state(s) 0 Aux is idle in state(s) 0 Trigger is idle in state(s) 0 Queue is idle in state(s) 0 LCD is idle in state(s) 0 Daemon is idle in state(s) 0 Autopause is idle in state(s) 0 Q0 segments left 0 Code queue 0 is empty === Filament sensors === check 77714844 clear 4016894 Extruder 0: pos 2398.71, errs: frame 92 parity 0 ovrun 631 pol 11 ovdue 0 === Network === Slowest loop: 221.55ms; fastest: 0.02ms Responder states: HTTP(0) HTTP(0) HTTP(0) FTP(0) Telnet(0) HTTP sessions: 3 of 8 Interface state active, link 100Mbps full duplex Socket states: 5 2 2 2 2 2 -
@emofes said in Bltouch not always triggering during bed probe:
A few things I'm wondering:
Are there any commonly known issues that would cause frequent network disconnects?Not with the Ethernet boards, they're pretty solid. There have been ups and downs with the WiFi versions over the years, but as far as I'm aware that's fixed now.
The controller is in an enclosure, and the Ethernet cable runs over the power supply; could there be an interference issue?
Possibly. If possible, re-route the Ethernet cable away from the PSU. It could be picking up interference, that is somehow interfering with the BLTouch servo control or signal wires.
The Ethernet cable connects to a coupler so that another Ethernet cable can be connected outside the enclosure. Maybe the coupler or one of the cables is bad and causing random disconnects?
Again, possibly, and similar to above, it may be picking up interference. You could try replacing the two-part cable with a single cable, temporarily.
Could a problem with DWC or the Ethernet connection be causing interrupts?
Like I said, something spamming the network might generate traffic that is interrupting the Duet. Your M122 command shows this:
=== Network ===
Slowest loop: 221.55ms; fastest: 0.02ms
Responder states: HTTP(0) HTTP(0) HTTP(0) FTP(0) Telnet(0)
HTTP sessions: 3 of 8
Interface state active, link 100Mbps full duplex
Socket states: 5 2 2 2 2 2
"Responder states" indicates what the protocol is currently doing, see the list here. 0 indicates it's currently 'free'.
"Http sessions" indicates there are 3 HTTP sessions. Are you connecting multiple browser tabs to the Duet? Reducing the number of HTTP sessions will help connectivity, ie close browser windows connected to the Duet that you are not using will free up the session.
"Socket states" indicates what the network sockets are actually doing, from the list here in RRF 3.5.4, where 2 is 'listening' (which means it is currently available) and 5 is 'closing' (if you ran M122 again, it's state would probably change to 2).So from this M122, nothing is happening, and most sessions and sockets are available. If you can grab an M122 during mesh levelling, it might be more revealing.
If the chip receives too many connection requests at once, the rest may be aborted, and that leads to connectivity issues. If you increase the number of HTTP sockets by disabling FTP/Telnet (if you are not using them, and have them enabled in config.g with M586), it's less likely to happen.
You haven't posted your full config.g, which might help.
Could using input shaping, mesh bed leveling, DWC, etc. be too much for the board to handle at once?
Not as far as I'm aware. The MCU on the Duet 2 WiFi/Ethernet is the same as on the Mini 5+, computationally. It is limited by flash memory and RAM, but @dc42 works hard to keep it functional.
Ian