Gathering & Interpreting accelerometer data for input shaping
-
@o_lampe said in Gathering & Interpreting accelerometer data for input shaping:
calculate the required minimum length of the move to fully accelerate and decelerate.
common formulas for constant acceleration
v = a * t =>  t = v/a
s = 1/2 a * t² => s= 1/2a * (v/a)²
For a printspeed of 100mm/s and acceleration of 4000mm/s² I got 1.25mm for fullspeed .
Deceleration is the same, so 2.5mm would be minimum travel distance. -
@owend I have changed to sampling the data right after the end of a move. Something like this (X0 Y0 is bed centre on all my printers):
G1 X-100 F6000 G4 S2 G1 X0 M400 M956 P0 S1000 A0
The advantage is that you don't get motor or belt noise in the data.
Duet WiFi hardware designer and firmware engineer
Please do not ask me for Duet support via PM or email, use the forum
http://www.escher3d.com, https://miscsolutions.wordpress.com -
@dc42
does that mean the sampling rate is fixed and the length of the move isn't important?
If so, is the sampling rate the same for Duet2 / Duet3mini / Duet 3 HC? -
@dc42
I changed the method per your suggestion and seem to get more readable samples.
Depending on the number of samples I specify, I get either a single peak at 21.9Hz or two peaks at about 21.9 & 55Hz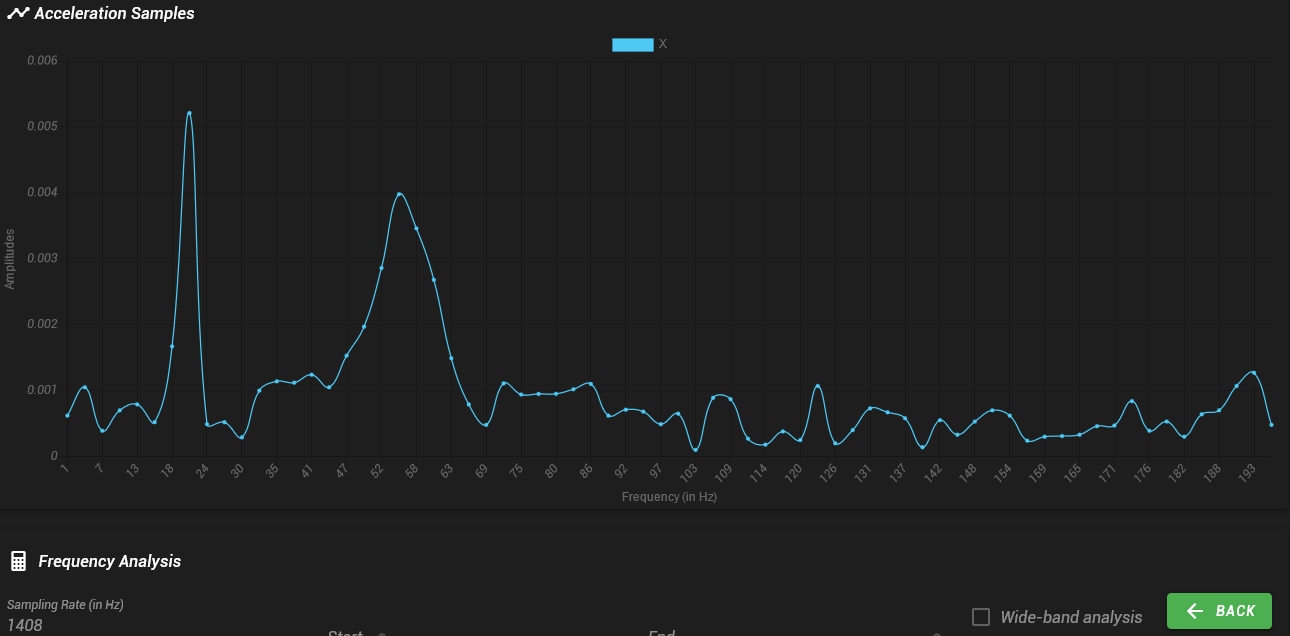
-
@owend what does the raw data look like? Do you get the same peaks for both X moves and Y moves?
Duet WiFi hardware designer and firmware engineer
Please do not ask me for Duet support via PM or email, use the forum
http://www.escher3d.com, https://miscsolutions.wordpress.com -
@o_lampe said in Gathering & Interpreting accelerometer data for input shaping:
@dc42
does that mean the sampling rate is fixed and the length of the move isn't important?
If so, is the sampling rate the same for Duet2 / Duet3mini / Duet 3 HC?The sampling rates are those available on the LIS3DH, so they are the same on all boards. The highest sampling rate available at standard resolution is 1344 samples/sec and that is the one I normally use (it's also the M955 default). If you select 8-bit resolution instead, then you can get 1620 or 5376 samples/sec; but I don't think it's useful to go that high, and at 5376 samples/sec writing the data fast enough to the SD card might be problematic.
-
@dc42 said in Gathering & Interpreting accelerometer data for input shaping:
@owend what does the raw data look like? Do you get the same peaks for both X moves and Y moves?
Here are images from another test.
The accelerometer is mounted on the X axis of a bed slinger and is in the "06" orientation.Interestingly, whatever I enter in M955, DWC reports it as being 20 orientation.
e.g.

The M955 setting for these tests was
M955 P0 I06 R10 S2000 Q2000000 C"spi.cs3+spi.cs4" ; configure accelerometerGcode issued was
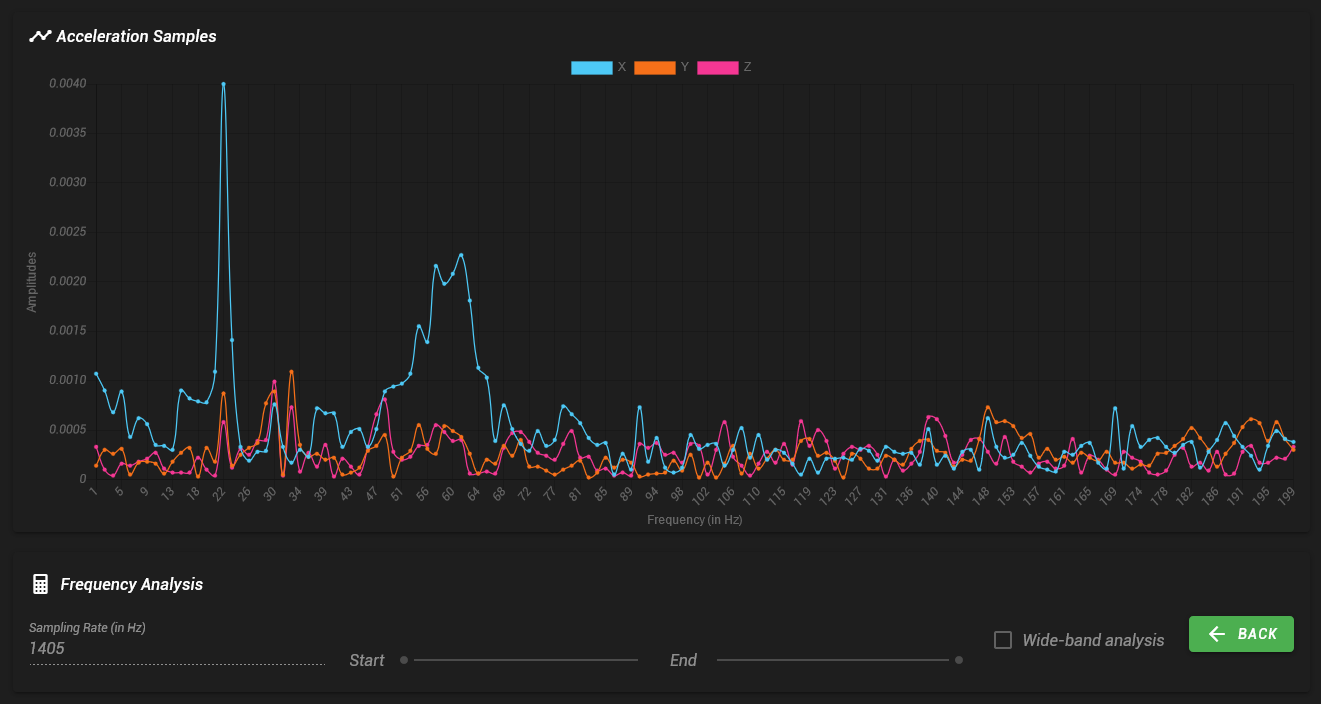
G1 X50 F6000 G4 S2 G1 X135 M400 M956 P0 S1000 A0Results Raw
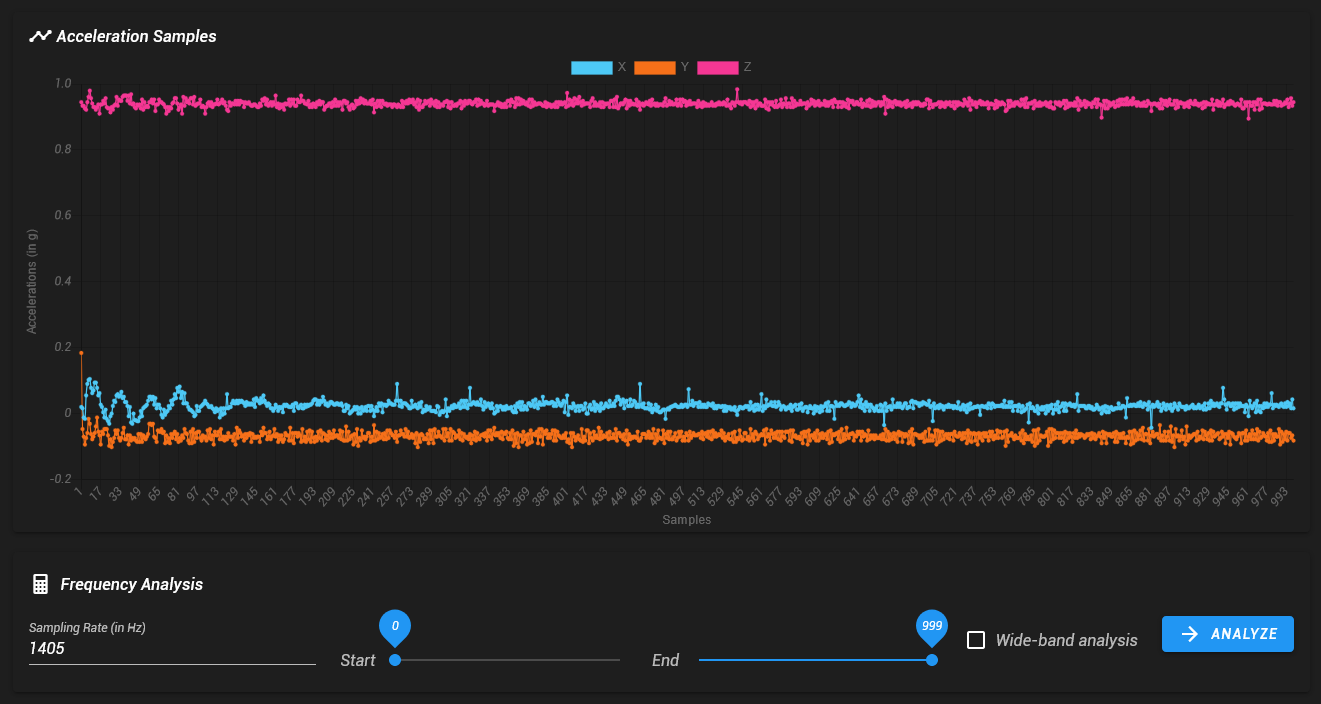
Results filtered
-
@owend
Wouldn't it be even better to put 'M84' before the actual sampling starts?
In your sample I think I see the motor noise, which then builds the 22Hz peak -
@o_lampe said in Gathering & Interpreting accelerometer data for input shaping:
Wouldn't it be even better to put 'M84' before the actual sampling starts?
No. If you do that then the motor will become much more elastic, because only the detent torque will hold it in place, and this will reduce the frequency of any resonance due to the mass+belt+motor combination.
-
@owend I can see two resonances in your raw data: a fairly strong but damped one at about 60Hz, and a slightly weaker one with very little damping at about 22Hz. They could be resonances of different axes. What does a plot of a Y move look like?
Duet WiFi hardware designer and firmware engineer
Please do not ask me for Duet support via PM or email, use the forum
http://www.escher3d.com, https://miscsolutions.wordpress.com -
This looks like so much fun. Are these graphs from DWC?
-
@dc42
I don't yet have a mount made for the bed, so no Y axis data
I'll work on it this week
I'd appreciate some reference marks on the images to define what you see as resonance and what's just noise.