RRF3.4 RC2 Filament error on extruder 0: sensorError
-
This just happened to me on a 14 hour print. I updated to RRF3.4. Came here to see what it could be. I resumed the print and is printing And it finished without any problems.
=== Diagnostics ===
RepRapFirmware for Duet 3 MB6HC version 3.4.0rc2 (2022-02-22 17:04:17) running on Duet 3 MB6HC v1.01 or later (SBC mode)
Board ID: 08DJM-956BA-NA3TN-6JTD0-3SJ6S-1V82V
Used output buffers: 10 of 40 (40 max)
=== RTOS ===
Static ram: 150984
Dynamic ram: 66520 of which 28 recycled
Never used RAM 129804, free system stack 114 words
Tasks: SBC(resourceWait:,0.7%,494) HEAT(notifyWait,0.0%,321) Move(notifyWait,1.7%,248) CanReceiv(notifyWait,0.0%,772) CanSender(notifyWait,0.0%,346) CanClock(delaying,0.0%,339) TMC(notifyWait,8.4%,58) MAIN(running,89.1%,923) IDLE(ready,0.0%,30), total 100.0%
Owned mutexes: HTTP(MAIN)
=== Platform ===
Last reset 15:54:21 ago, cause: power up
Last software reset at 2022-03-09 01:00, reason: HardFault, GCodes spinning, available RAM 130308, slot 1
Software reset code 0x4063 HFSR 0x80000000 CFSR 0x00000000 ICSR 0x00400803 BFAR 0x00000000 SP 0x2041b4f8 Task MAIN Freestk 1672 ok
Stack: 20429f28 2042c2d8 2041b594 00000001 0000002e 0045c81b 0045c676 61070000 20419a7c 2042bf34 00000000 00000001 00000000 004844d7 2042bf34 00000000 00000000 0048481f 003ffff0 004849f7 20429860 ffffffff 0934d918 2042bf34 20419a7c 2042c2dc ffffffff
Error status: 0x04
Aux0 errors 0,0,0
Step timer max interval 135
MCU temperature: min 47.3, current 47.5, max 47.7
Supply voltage: min 23.9, current 24.0, max 24.1, under voltage events: 0, over voltage events: 0, power good: yes
12V rail voltage: min 12.0, current 12.1, max 12.1, under voltage events: 0
Heap OK, handles allocated/used 99/1, heap memory allocated/used/recyclable 2048/160/126, gc cycles 0
Events: 2 queued, 2 completed
Driver 0: pos 60689, ok, SG min 0, mspos 928, reads 41145, writes 0 timeouts 0
Driver 1: pos 14056, ok, SG min 0, mspos 616, reads 41145, writes 0 timeouts 0
Driver 2: pos 50096, standstill, SG min 0, mspos 72, reads 41145, writes 0 timeouts 0
Driver 3: pos 0, standstill, SG min 0, mspos 664, reads 41146, writes 0 timeouts 0
Driver 4: pos 0, standstill, SG min 0, mspos 152, reads 41146, writes 0 timeouts 0
Driver 5: pos 0, standstill, SG min 0, mspos 104, reads 41145, writes 0 timeouts 0
Date/time: 2022-03-09 16:28:53
Slowest loop: 31.03ms; fastest: 0.05ms
=== Storage ===
Free file entries: 10
SD card 0 not detected, interface speed: 37.5MBytes/sec
SD card longest read time 0.0ms, write time 0.0ms, max retries 0
=== Move ===
DMs created 125, segments created 20, maxWait 796ms, bed compensation in use: none, comp offset 0.000
=== MainDDARing ===
Scheduled moves 678710, completed 678677, hiccups 0, stepErrors 0, LaErrors 0, Underruns [0, 0, 0], CDDA state 3
=== AuxDDARing ===
Scheduled moves 0, completed 0, hiccups 0, stepErrors 0, LaErrors 0, Underruns [0, 0, 0], CDDA state -1
=== Heat ===
Bed heaters 0 -1 -1 -1 -1 -1 -1 -1 -1 -1 -1 -1, chamber heaters -1 -1 -1 -1, ordering errs 0
Heater 0 is on, I-accum = 0.3
Heater 1 is on, I-accum = 0.0
=== GCodes ===
Segments left: 1
Movement lock held by null
HTTP* is doing "M122" in state(s) 0 0, running macro
Telnet is idle in state(s) 0
File* is doing "G1 X453.419006 Y257.640015 E-0.570000" in state(s) 0
USB is idle in state(s) 0
Aux is idle in state(s) 0
Trigger* is idle in state(s) 0
Queue* is idle in state(s) 0
LCD is idle in state(s) 0
SBC is idle in state(s) 0
Daemon is idle in state(s) 0
Aux2 is idle in state(s) 0
Autopause* is idle in state(s) 0
Code queue is empty
=== Filament sensors ===
Extruder 0: no data received
=== CAN ===
Messages queued 15065, received 12407, lost 0, boc 0
Longest wait 0ms for reply type 0, peak Tx sync delay 268, free buffers 50 (min 47), ts 3026/3026/0
Tx timeouts 0,0,0,0,0,0
=== SBC interface ===
Transfer state: 4, failed transfers: 0, checksum errors: 0
RX/TX seq numbers: 15043/15043
SPI underruns 0, overruns 0
State: 5, disconnects: 0, timeouts: 0, IAP RAM available 0x2b8b0
Buffer RX/TX: 1520/2544-0, open files: 0
=== Duet Control Server ===
Duet Control Server v3.4-rc2
File /opt/dsf/sd/gcodes/Pandero11in_Escalas_0.6n_0.3mm_PLA_13h57m.gcode is selected, processing
HTTP:
Executing macro 0:/macros/Diagnostics, started by M98 P"0:/macros/Diagnostics"
> Next stack level
File:
Buffered code: G1 X453.419 Y257.64 E-.57
Buffered code: G1 E-.03 F2400
Buffered code: G1 Z63.02 F720
Buffered code: G1 X457.643 Y264.663 F10800
Buffered code: G1 Z62.62 F720
Buffered code: G1 E.6 F2400
Buffered code: G1 F4200
Buffered code: G1 X458.599 Y265.619 E.09391
Buffered code: G1 F8640
Buffered code: G1 X457.643 Y264.663 E-.35695
Buffered code: G1 E-.24305 F2400
Buffered code: G1 Z63.02 F720
Buffered code: G1 X459.911 Y269.805 F10800
Buffered code: G1 Z62.62 F720
Buffered code: G1 E.6 F2400
Buffered code: G1 F4200
Buffered code: G1 X460.905 Y270.799 E.09959
Buffered code: G1 F8640
Buffered code: G1 X459.911 Y269.805 E-.37085
Buffered code: G1 E-.22915 F2400
Buffered code: G1 Z63.02 F720
Buffered code: G1 X463.158 Y276.331 F10800
Buffered code: G1 Z62.62 F720
Buffered code: G1 E.6 F2400
==> 992 bytes
Code buffer space: 1552
Configured SPI speed: 8000000Hz, TfrRdy pin glitches: 0
Full transfers per second: 39.36, max time between full transfers: 44.0ms, max pin wait times: 29.1ms/8.3ms
Codes per second: 18.47
Maximum length of RX/TX data transfers: 3928/1628
Started a second print this one 17 hours long and by hour 5 I got the
3/10/2022, 3:12:23 AM Error: Filament error on extruder 0: sensorErrorDiagnostics:
3/10/2022, 10:08:44 AM 	=== Diagnostics ===
RepRapFirmware for Duet 3 MB6HC version 3.4.0rc2 (2022-02-22 17:04:17) running on Duet 3 MB6HC v1.01 or later (SBC mode)
Board ID: 08DJM-956BA-NA3TN-6JTD0-3SJ6S-1V82V
Used output buffers: 6 of 40 (40 max)
=== RTOS ===
Static ram: 150984
Dynamic ram: 66520 of which 28 recycled
Never used RAM 129876, free system stack 128 words
Tasks: SBC(resourceWait:,14.6%,504) HEAT(notifyWait,0.3%,321) Move(notifyWait,17.9%,248) CanReceiv(notifyWait,0.5%,772) CanSender(notifyWait,0.2%,346) CanClock(delaying,0.1%,339) TMC(notifyWait,185.9%,58) MAIN(running,156.5%,923) IDLE(ready,0.1%,30), total 376.1%
Owned mutexes: HTTP(MAIN)
=== Platform ===
Last reset 13:18:07 ago, cause: power up
Last software reset at 2022-03-10 01:24, reason: AssertionFailed, GCodes spinning, available RAM 129804, slot 2
Software reset code 0x4123 HFSR 0x00000000 CFSR 0x00000000 ICSR 0x00400000 BFAR 0x00000000 SP 0x2041b53c Task MAIN Freestk 1689 ok
Stack: 00000599 004a3b00 00484adb 20429860 ffffffff 9b6a2e4b 2042c2dc 20419a7c 2042e1c4 ffffffff 00000000 9b6a2e7a 00484b0d 2041b58c 20429f28 20421e98 0048229f 2042e1c0 0045c7f3 00000000 2042e1c4 00000000 2041b59c 00000101 00000000 00000000 00000000
Error status: 0x04
Aux0 errors 0,0,0
Step timer max interval 180
MCU temperature: min 35.1, current 45.6, max 48.3
Supply voltage: min 23.9, current 24.0, max 24.1, under voltage events: 0, over voltage events: 0, power good: yes
12V rail voltage: min 12.0, current 12.1, max 12.2, under voltage events: 0
Heap OK, handles allocated/used 99/1, heap memory allocated/used/recyclable 2048/100/60, gc cycles 0
Events: 1 queued, 1 completed
Driver 0: pos 40039, ok, SG min 0, mspos 725, reads 50511, writes 17 timeouts 0
Driver 1: pos 16068, ok, SG min 0, mspos 530, reads 50512, writes 17 timeouts 0
Driver 2: pos 16792, ok, SG min 0, mspos 437, reads 50512, writes 17 timeouts 0
Driver 3: pos 0, ok, SG min 0, mspos 715, reads 50512, writes 17 timeouts 0
Driver 4: pos 0, ok, SG min 0, mspos 267, reads 50512, writes 17 timeouts 0
Driver 5: pos 0, ok, SG min 0, mspos 149, reads 50512, writes 17 timeouts 0
Date/time: 2022-03-10 14:38:24
Slowest loop: 977.23ms; fastest: 0.04ms
=== Storage ===
Free file entries: 10
SD card 0 not detected, interface speed: 37.5MBytes/sec
SD card longest read time 0.0ms, write time 0.0ms, max retries 0
=== Move ===
DMs created 125, segments created 17, maxWait 24379276ms, bed compensation in use: mesh, comp offset -0.455
=== MainDDARing ===
Scheduled moves 290327, completed 290301, hiccups 0, stepErrors 0, LaErrors 0, Underruns [0, 0, 1], CDDA state 3
=== AuxDDARing ===
Scheduled moves 0, completed 0, hiccups 0, stepErrors 0, LaErrors 0, Underruns [0, 0, 0], CDDA state -1
=== Heat ===
Bed heaters 0 -1 -1 -1 -1 -1 -1 -1 -1 -1 -1 -1, chamber heaters -1 -1 -1 -1, ordering errs 0
Heater 0 is on, I-accum = 0.2
Heater 1 is on, I-accum = 0.0
=== GCodes ===
Segments left: 1
Movement lock held by null
HTTP* is doing "M122" in state(s) 0 0, running macro
Telnet is idle in state(s) 0
File* is doing "G1 Z20.799999 F720" in state(s) 0
USB is idle in state(s) 0
Aux is idle in state(s) 0
Trigger* is idle in state(s) 0
Queue* is idle in state(s) 0
LCD is idle in state(s) 0
SBC is idle in state(s) 0
Daemon is idle in state(s) 0
Aux2 is idle in state(s) 0
Autopause* is idle in state(s) 0
Code queue is empty
=== Filament sensors ===
Extruder 0: no data received
=== CAN ===
Messages queued 704031, received 981440, lost 0, boc 0
Longest wait 2ms for reply type 6026, peak Tx sync delay 279, free buffers 50 (min 45), ts 239437/239436/0
Tx timeouts 0,0,0,0,0,0
=== SBC interface ===
Transfer state: 4, failed transfers: 0, checksum errors: 0
RX/TX seq numbers: 35269/35269
SPI underruns 0, overruns 0
State: 5, disconnects: 0, timeouts: 0, IAP RAM available 0x2b8b0
Buffer RX/TX: 2064/3296-0, open files: 0
=== Duet Control Server ===
Duet Control Server v3.4-rc2
File /opt/dsf/sd/gcodes/Pandero 14in escalas_0.6n_0.3mm_PLA_18h27m.gcode is selected, processing
HTTP:
Executing macro 0:/macros/Diagnostics, started by M98 P"0:/macros/Diagnostics"
> Next stack level
File:
Buffered code: G1 Z20.4 F720
Buffered code: G1 E.6 F2400
Buffered code: G1 F4200
Buffered code: G1 X311.863 Y149.869 E.138
Buffered code: G1 F8640
Buffered code: G1 X313.184 Y148.549 E-.4928
Buffered code: G1 E-.1072 F2400
Buffered code: G1 Z20.8 F720
Buffered code: G1 X311.471 Y154.535 F10800
Buffered code: G1 Z20.4 F720
Buffered code: G1 E.6 F2400
Buffered code: G1 F4200
Buffered code: G1 X310.523 Y154.629 E.06607
Buffered code: G1 X308.988 Y154.828 E.1074
Buffered code: G1 X309.043 Y154.72 E.00841
Buffered code: G1 X309.595 Y154.092 E.05804
Buffered code: G1 X310.231 Y153.463 E.06202
Buffered code: G1 X310.72 Y152.835 E.05527
Buffered code: G1 X311.017 Y152.207 E.04823
Buffered code: G1 X311.163 Y151.578 E.04476
Buffered code: G1 X311.183 Y150.95 E.04362
Buffered code: G1 X311.061 Y150.322 E.04441
Buffered code: G1 X310.743 Y149.693 E.04886
Buffered code: G1 X310.565 Y149.491 E.01873
Buffered code: G1 X307.182 Y150.524 E.24546
==> 1104 bytes
Pending code: G1 X307.075 Y150.73 E.01612
Pending code: G1 X306.5 Y150.911 E.04182
Code buffer space: 2056
Configured SPI speed: 8000000Hz, TfrRdy pin glitches: 0
Full transfers per second: 37.64, max time between full transfers: 83.8ms, max pin wait times: 62.5ms/6.9ms
Codes per second: 6.04
Maximum length of RX/TX data transfers: 3712/1716
tool board 1lc diagnostics
3/10/2022, 10:21:58 AM 	M122 B121
Diagnostics for board 121:
Duet TOOL1LC rev 1.1 or later firmware version 3.4.0rc2 (2022-02-22 10:15:02)
Bootloader ID: SAMC21 bootloader version 2.3 (2021-01-26b1)
All averaging filters OK
Never used RAM 2204, free system stack 17 words
Tasks: Move(notifyWait,4.4%,99) HEAT(notifyWait,4.8%,95) CanAsync(notifyWait,0.0%,55) CanRecv(notifyWait,0.8%,74) CanClock(notifyWait,0.3%,65) ACCEL(notifyWait,0.0%,61) TMC(notifyWait,51.5%,57) MAIN(running,153.6%,351) IDLE(ready,0.0%,26) AIN(delaying,84.1%,142), total 299.6%
Last reset 13:31:22 ago, cause: VDD brownout
Last software reset data not available
Driver 0: pos 22986108, 405.0 steps/mm,standstill, SG min 0, read errors 20, write errors 0, ifcnt 13, reads 28334, writes 13, timeouts 7, DMA errors 0, CC errors 0, failedOp 0x41, steps req 25729946 done 25729946
Moves scheduled 288224, completed 288224, in progress 0, hiccups 125, step errors 0, maxPrep 665, maxOverdue 8517, maxInc 8517, mcErrs 0, gcmErrs 0
Peak sync jitter 1/6, peak Rx sync delay 232, resyncs 0/0, no step interrupt scheduled
VIN voltage: min 24.1, current 24.3, max 24.5
MCU temperature: min 37.8C, current 51.0C, max 53.2C
Last sensors broadcast 0x00000002 found 1 81 ticks ago, 0 ordering errs, loop time 0
CAN messages queued 997750, send timeouts 0, received 726318, lost 0, free buffers 37, min 36, error reg 0
dup 0, oos 0/0/0/0, bm 0, wbm 0, rxMotionDelay 617, adv 35626/74661
Accelerometer: LIS3DH, status: 00
I2C bus errors 0, naks 3, other errors 0
=== Filament sensors ===
Interrupt 4 to 97us, poll 8 to 2542us
Driver 0: pos 285.47, errs: frame 88 parity 0 ovrun 0 pol 0 ovdue 0
Happened again at 44.5% of the print the same error code:
3/10/2022, 2:47:01 PM Error: Filament error on extruder 0: sensorErrorThis time I did the diagnostic codes before I resumed the print.
M1223/10/2022, 4:32:40 PM M122 === Diagnostics === RepRapFirmware for Duet 3 MB6HC version 3.4.0rc2 (2022-02-22 17:04:17) running on Duet 3 MB6HC v1.01 or later (SBC mode) Board ID: 08DJM-956BA-NA3TN-6JTD0-3SJ6S-1V82V Used output buffers: 8 of 40 (40 max) === RTOS === Static ram: 150984 Dynamic ram: 66520 of which 28 recycled Never used RAM 129828, free system stack 128 words Tasks: SBC(ready,120.2%,504) HEAT(notifyWait,2.6%,321) Move(notifyWait,231.3%,248) CanReceiv(notifyWait,4.1%,772) CanSender(notifyWait,3.2%,346) CanClock(delaying,0.9%,339) TMC(notifyWait,1474.5%,58) MAIN(running,2710.9%,923) IDLE(ready,0.1%,30), total 4547.8% Owned mutexes: HTTP(MAIN) === Platform === Last reset 19:42:02 ago, cause: power up Last software reset at 2022-03-10 01:24, reason: AssertionFailed, GCodes spinning, available RAM 129804, slot 2 Software reset code 0x4123 HFSR 0x00000000 CFSR 0x00000000 ICSR 0x00400000 BFAR 0x00000000 SP 0x2041b53c Task MAIN Freestk 1689 ok Stack: 00000599 004a3b00 00484adb 20429860 ffffffff 9b6a2e4b 2042c2dc 20419a7c 2042e1c4 ffffffff 00000000 9b6a2e7a 00484b0d 2041b58c 20429f28 20421e98 0048229f 2042e1c0 0045c7f3 00000000 2042e1c4 00000000 2041b59c 00000101 00000000 00000000 00000000 Error status: 0x04 Aux0 errors 0,0,0 Step timer max interval 149 MCU temperature: min 45.4, current 47.2, max 48.7 Supply voltage: min 23.9, current 24.0, max 24.1, under voltage events: 0, over voltage events: 0, power good: yes 12V rail voltage: min 12.0, current 12.1, max 12.1, under voltage events: 0 Heap OK, handles allocated/used 99/1, heap memory allocated/used/recyclable 2048/160/120, gc cycles 0 Events: 2 queued, 2 completed Driver 0: pos 36230, standstill, SG min 0, mspos 104, reads 17097, writes 0 timeouts 0 Driver 1: pos -35430, standstill, SG min 0, mspos 904, reads 17097, writes 0 timeouts 0 Driver 2: pos 40272, standstill, SG min 0, mspos 312, reads 17097, writes 0 timeouts 0 Driver 3: pos 0, standstill, SG min 0, mspos 840, reads 17097, writes 0 timeouts 0 Driver 4: pos 0, standstill, SG min 0, mspos 392, reads 17098, writes 0 timeouts 0 Driver 5: pos 0, standstill, SG min 0, mspos 24, reads 17098, writes 0 timeouts 0 Date/time: 2022-03-10 21:02:19 Slowest loop: 50.08ms; fastest: 0.04ms === Storage === Free file entries: 10 SD card 0 not detected, interface speed: 37.5MBytes/sec SD card longest read time 0.0ms, write time 0.0ms, max retries 0 === Move === DMs created 125, segments created 19, maxWait 1260ms, bed compensation in use: mesh, comp offset -0.455 === MainDDARing === Scheduled moves 602559, completed 602559, hiccups 0, stepErrors 0, LaErrors 0, Underruns [0, 0, 0], CDDA state -1 === AuxDDARing === Scheduled moves 0, completed 0, hiccups 0, stepErrors 0, LaErrors 0, Underruns [0, 0, 0], CDDA state -1 === Heat === Bed heaters 0 -1 -1 -1 -1 -1 -1 -1 -1 -1 -1 -1, chamber heaters -1 -1 -1 -1, ordering errs 0 Heater 0 is on, I-accum = 0.2 Heater 1 is on, I-accum = 0.0 === GCodes === Segments left: 0 Movement lock held by null HTTP* is doing "M122" in state(s) 0 Telnet is idle in state(s) 0 File* is idle in state(s) 0 USB is idle in state(s) 0 Aux is idle in state(s) 0 Trigger* is idle in state(s) 0 Queue* is idle in state(s) 0 LCD is idle in state(s) 0 SBC is idle in state(s) 0 Daemon is idle in state(s) 0 Aux2 is idle in state(s) 0 Autopause* is idle in state(s) 0 Code queue is empty === Filament sensors === Extruder 0: no data received === CAN === Messages queued 494841, received 472277, lost 0, boc 0 Longest wait 5ms for reply type 6024, peak Tx sync delay 301, free buffers 50 (min 45), ts 115176/115176/0 Tx timeouts 0,0,0,0,0,0 === SBC interface === Transfer state: 4, failed transfers: 0, checksum errors: 0 RX/TX seq numbers: 22180/22180 SPI underruns 0, overruns 0 State: 5, disconnects: 0, timeouts: 0, IAP RAM available 0x2b8b0 Buffer RX/TX: 0/0-0, open files: 0 === Duet Control Server === Duet Control Server v3.4-rc2 File /opt/dsf/sd/gcodes/Pandero 14in escalas_0.6n_0.3mm_PLA_18h27m.gcode is selected, paused Code buffer space: 4096 Configured SPI speed: 8000000Hz, TfrRdy pin glitches: 0 Full transfers per second: 39.26, max time between full transfers: 77.9ms, max pin wait times: 60.7ms/10.7ms Codes per second: 14.20 Maximum length of RX/TX data transfers: 3768/1716M122 B121
3/10/2022, 4:33:34 PM 	M122 B121
Diagnostics for board 121:
Duet TOOL1LC rev 1.1 or later firmware version 3.4.0rc2 (2022-02-22 10:15:02)
Bootloader ID: SAMC21 bootloader version 2.3 (2021-01-26b1)
All averaging filters OK
Never used RAM 2204, free system stack 17 words
Tasks: Move(notifyWait,2.4%,99) HEAT(notifyWait,1.2%,95) CanAsync(notifyWait,0.0%,55) CanRecv(notifyWait,0.4%,74) CanClock(notifyWait,0.1%,65) ACCEL(notifyWait,0.0%,61) TMC(notifyWait,13.3%,57) MAIN(running,60.9%,351) IDLE(ready,0.0%,26) AIN(delaying,21.7%,142), total 100.0%
Last reset 19:42:58 ago, cause: VDD brownout
Last software reset data not available
Driver 0: pos 35910153, 405.0 steps/mm,standstill, SG min 0, read errors 10, write errors 0, ifcnt 13, reads 15749, writes 0, timeouts 3, DMA errors 0, CC errors 0, failedOp 0x06, steps req 16566495 done 16566495
Moves scheduled 560607, completed 560607, in progress 0, hiccups 0, step errors 0, maxPrep 681, maxOverdue 0, maxInc 0, mcErrs 0, gcmErrs 0
Peak sync jitter 1/8, peak Rx sync delay 235, resyncs 0/0, no step interrupt scheduled
VIN voltage: min 24.1, current 24.3, max 24.3
MCU temperature: min 37.8C, current 48.2C, max 53.2C
Last sensors broadcast 0x00000002 found 1 70 ticks ago, 0 ordering errs, loop time 0
CAN messages queued 457092, send timeouts 0, received 473045, lost 0, free buffers 37, min 36, error reg 0
dup 0, oos 0/0/0/0, bm 0, wbm 0, rxMotionDelay 601, adv 35676/74660
Accelerometer: LIS3DH, status: 00
I2C bus errors 0, naks 0, other errors 0
=== Filament sensors ===
Interrupt 4 to 34us, poll 8 to 2477us
Driver 0: pos 139.92, errs: frame 206 parity 0 ovrun 0 pol 0 ovdue 0
M591 D0
3/10/2022, 4:37:28 PM 	M591 D0
Duet3D rotating magnet filament monitor v3 on pin 121.io1.in, enabled, sensitivity 28.80mm/rev, allow 35% to 130%, check printing moves every 20.0mm, version 3, mag 129 agc 85, measured sensitivity 24.74mm/rev, min 98% max 103% over 33743.9mm
Continued the print and have not disabled the sensor. I'll post if I get the error again or if the print finishes successfully.
-
 undefined charliedrums referenced this topic
-
It happened a third time at arround 90% complete. same error
3/11/2022, 2:09:48 AM Error: Filament error on extruder 0: sensorError -
How is your cabling run?
Our best guess is that interference is corrupting the signal from the MFM and that RRF 3.3 wasn't very good at reporting that type of error.
Are you able to swap back to 3.3 to see if it becomes less sensitive again?
-
@phaedrux Yes I can.
I'm Going to run a 17 hour print with the cable routed by itself away from any other cable. (it is connected to the toolboard 1LC. See if I get the error and then I'll downgrade to 3.3. Do I also have to downgrade the toolbard to 3.3?
-
@charliedrums said in RRF3.4 RC2 Filament error on extruder 0: sensorError:
Do I also have to downgrade the toolbard to 3.3?
Probably should yes.
-
Just got the same error with the sensor cables not touching or near any other cable.
-
What gauge wire should I be using for the filament sensor?
-
I don't think the gauge is especially critical as it's just low voltage signaling. Noise rejection would be more important. You could try braiding the cable, but if it's already running away from other cables that shouldn't be an issue either, but even a longer run of wire can act as an antenna I suppose.
-
Finished downgrading the 6hc and 1lc to 3.3. Going to start a 17 hour print and see how it goes will report back with findings
-
Just got the same error but this time it is not on the console event. It was a pop out on the DWC where it says printing paused because extruder 0 reported "sensor error" once I close it there is nothing on the console.
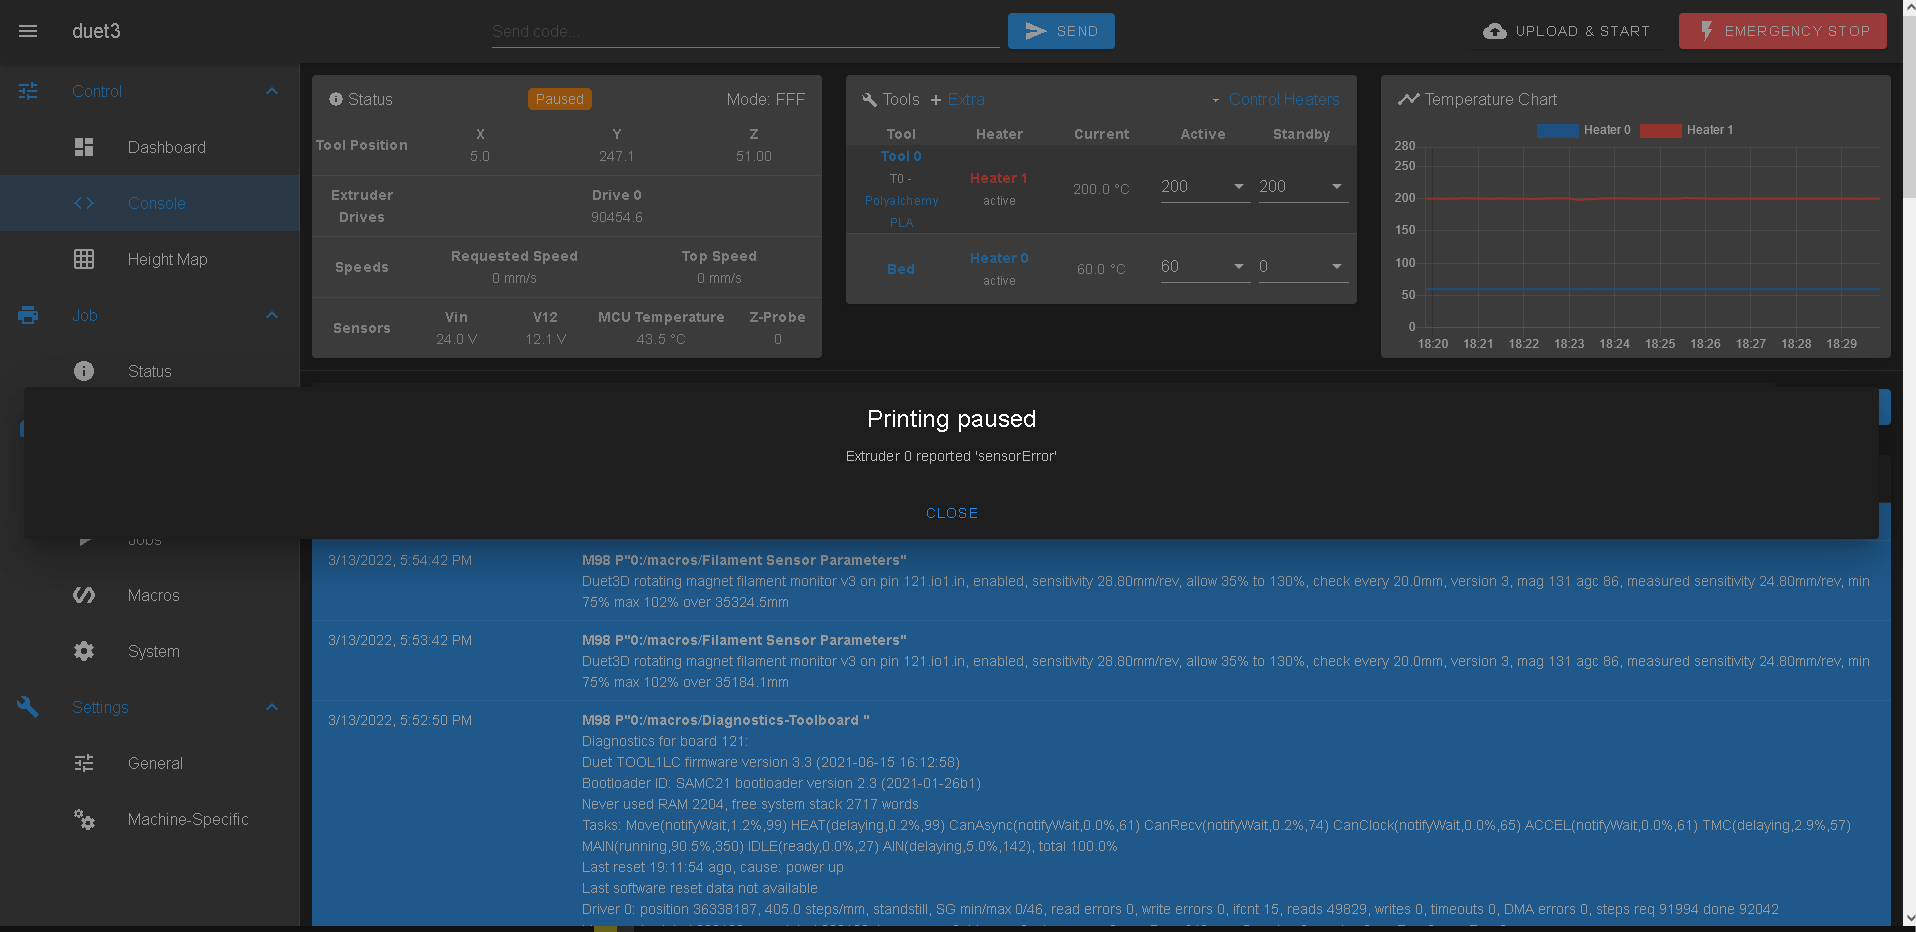
Prior to resuming the print:
M591 D0
Duet3D rotating magnet filament monitor v3 on pin 121.io1.in, enabled, sensitivity 28.80mm/rev, allow 35% to 130%, check every 20.0mm, version 3, mag 129 agc 86, measured sensitivity 24.80mm/rev, min 75% max 102% over 39118.1mmDiagnostics
=== Diagnostics ===
RepRapFirmware for Duet 3 MB6HC version 3.3 (2021-06-15 21:45:47) running on Duet 3 MB6HC v1.01 or later (SBC mode)
Board ID: 08DJM-956BA-NA3TN-6JTD0-3SJ6S-1V82V
Used output buffers: 1 of 40 (40 max)
=== RTOS ===
Static ram: 150904
Dynamic ram: 62356 of which 124 recycled
Never used RAM 137952, free system stack 127 words
Tasks: SBC(ready,4.6%,328) HEAT(delaying,0.0%,325) Move(notifyWait,0.3%,250) CanReceiv(notifyWait,0.0%,774) CanSender(notifyWait,0.0%,362) CanClock(delaying,0.0%,339) TMC(notifyWait,8.1%,59) MAIN(running,86.9%,922) IDLE(ready,0.0%,29), total 100.0%
Owned mutexes: HTTP(MAIN)
=== Platform ===
Last reset 19:55:56 ago, cause: power up
Last software reset at 2022-03-13 02:40, reason: HardFault, GCodes spinning, available RAM 141068, slot 1
Software reset code 0x4063 HFSR 0x40000000 CFSR 0x00080000 ICSR 0x0440f803 BFAR 0x00092040 SP 0x2041b180 Task MAIN Freestk 1663 ok
Stack: 00000002 ffffffff 20418194 ffffffff 00000004 0047a67b 0047a714 610f0000 00000000 00000000 4ae049bf 0000000a 00000000 2042b7f0 20419728 2042cd74 00000000 44800000 003ffff5 0047a1d7 2042cd74 00000000 00000000 0047a51f 00000000 0047a67b 20429710
Error status: 0x04
Aux0 errors 0,0,0
Step timer max interval 208
MCU temperature: min 43.2, current 43.5, max 43.8
Supply voltage: min 23.9, current 24.0, max 24.1, under voltage events: 0, over voltage events: 0, power good: yes
12V rail voltage: min 12.0, current 12.1, max 12.1, under voltage events: 0
Heap OK, handles allocated/used 99/1, heap memory allocated/used/recyclable 2048/72/36, gc cycles 0
Driver 0: position 20165, standstill, reads 17186, writes 0 timeouts 0, SG min/max 0/1023
Driver 1: position -19365, standstill, reads 17187, writes 0 timeouts 0, SG min/max 0/1023
Driver 2: position 41331, standstill, reads 17186, writes 0 timeouts 0, SG min/max 0/1023
Driver 3: position 0, standstill, reads 17186, writes 0 timeouts 0, SG min/max 0/1023
Driver 4: position 0, standstill, reads 17186, writes 0 timeouts 0, SG min/max 0/1023
Driver 5: position 0, standstill, reads 17186, writes 0 timeouts 0, SG min/max 0/1023
Date/time: 2022-03-13 22:36:53
Slowest loop: 137.66ms; fastest: 0.02ms
=== Storage ===
Free file entries: 10
SD card 0 not detected, interface speed: 37.5MBytes/sec
SD card longest read time 0.0ms, write time 0.0ms, max retries 0
=== Move ===
DMs created 125, maxWait 0ms, bed compensation in use: mesh, comp offset -0.046
=== MainDDARing ===
Scheduled moves 965980, completed moves 965980, hiccups 0, stepErrors 0, LaErrors 0, Underruns [0, 0, 0], CDDA state -1
=== AuxDDARing ===
Scheduled moves 0, completed moves 0, hiccups 0, stepErrors 0, LaErrors 0, Underruns [0, 0, 0], CDDA state -1
=== Heat ===
Bed heaters = 0 -1 -1 -1 -1 -1 -1 -1 -1 -1 -1 -1, chamberHeaters = -1 -1 -1 -1
Heater 0 is on, I-accum = 0.2
Heater 1 is on, I-accum = 0.0
=== GCodes ===
Segments left: 0
Movement lock held by null
HTTP* is doing "M122" in state(s) 0 0, running macro
Telnet is idle in state(s) 0
File* is idle in state(s) 0
USB is idle in state(s) 0
Aux is idle in state(s) 0
Trigger* is idle in state(s) 0
Queue* is idle in state(s) 0
LCD is idle in state(s) 0
SBC is idle in state(s) 0
Daemon is idle in state(s) 0
Aux2 is idle in state(s) 0
Autopause* is idle in state(s) 0
Code queue is empty.
=== Filament sensors ===
Extruder 0: no data received
=== CAN ===
Messages queued 96919, received 34382, lost 0, longest wait 5ms for reply type 6024, peak Tx sync delay 286, free buffers 49 (min 32), ts 13721/13721/0
Tx timeouts 0,0,0,0,0,0
=== SBC interface ===
State: 4, failed transfers: 1, checksum errors: 0
Last transfer: 2ms ago
RX/TX seq numbers: 6693/6693
SPI underruns 0, overruns 0
Disconnects: 0, timeouts: 0, IAP RAM available 0x2c810
Buffer RX/TX: 0/0-0
=== Duet Control Server ===
Duet Control Server v3.3.0
HTTP:
Executing macro 0:/macros/Diagnostics, started by M98 P"0:/macros/Diagnostics"
> Next stack level
Code buffer space: 4096
Configured SPI speed: 8000000Hz
Full transfers per second: 47.19, max wait times: 90.0ms/0.0ms
Codes per second: 27.73
Maximum length of RX/TX data transfers: 4403/1700
File /opt/dsf/sd/gcodes/Pandero 14in Mesh_0.6n_0.3mm_PLA_14h16m.gcode is selected, paused
Toolboard diagnostics
Diagnostics for board 121:
Duet TOOL1LC firmware version 3.3 (2021-06-15 16:12:58)
Bootloader ID: SAMC21 bootloader version 2.3 (2021-01-26b1)
Never used RAM 2204, free system stack 2717 words
Tasks: Move(notifyWait,1.0%,99) HEAT(delaying,0.2%,99) CanAsync(notifyWait,0.0%,61) CanRecv(notifyWait,0.2%,74) CanClock(notifyWait,0.0%,65) ACCEL(notifyWait,0.0%,61) TMC(delaying,2.9%,57) MAIN(running,90.6%,350) IDLE(ready,0.0%,27) AIN(delaying,5.0%,142), total 100.0%
Last reset 19:56:02 ago, cause: power up
Last software reset data not available
Driver 0: position 38031462, 405.0 steps/mm, standstill, SG min/max 0/48, read errors 0, write errors 0, ifcnt 15, reads 976, writes 0, timeouts 1, DMA errors 0, failedOp 0x06, steps req 1994653 done 1994653
Moves scheduled 951641, completed 951641, in progress 0, hiccups 0, step errors 0, maxPrep 684, maxOverdue 0, maxInc 0, mcErrs 0, gcmErrs 0
Peak sync jitter 0/6, peak Rx sync delay 218, resyncs 0/0, no step interrupt scheduled
VIN: 24.3V
MCU temperature: min 40.7C, current 44.7C, max 52.8C
Ticks since heat task active 98, ADC conversions started 71537725, completed 71537700, timed out 24, errs 0
Last sensors broadcast 0x00000002 found 1 103 ticks ago, loop time 0
CAN messages queued 33134, send timeouts 0, received 93367, lost 0, free buffers 37, min 35, error reg 0
dup 0, oos 0/0/0/0, bm 0, wbm 0, rxMotionDelay 889, adv 22052/74662
Accelerometer detected: yes, status: 00
I2C bus errors 0, naks 0, other errors 0
=== Filament sensors ===
Interrupt 4 to 36us, poll 8 to 7086us
Driver 0: pos 121.29, errs: frame 306 parity 0 ovrun 0 pol 0 ovdue 0
Once the print finishes I plan on remaking the small harness for the filament sensor to see if that helps in any way.
-
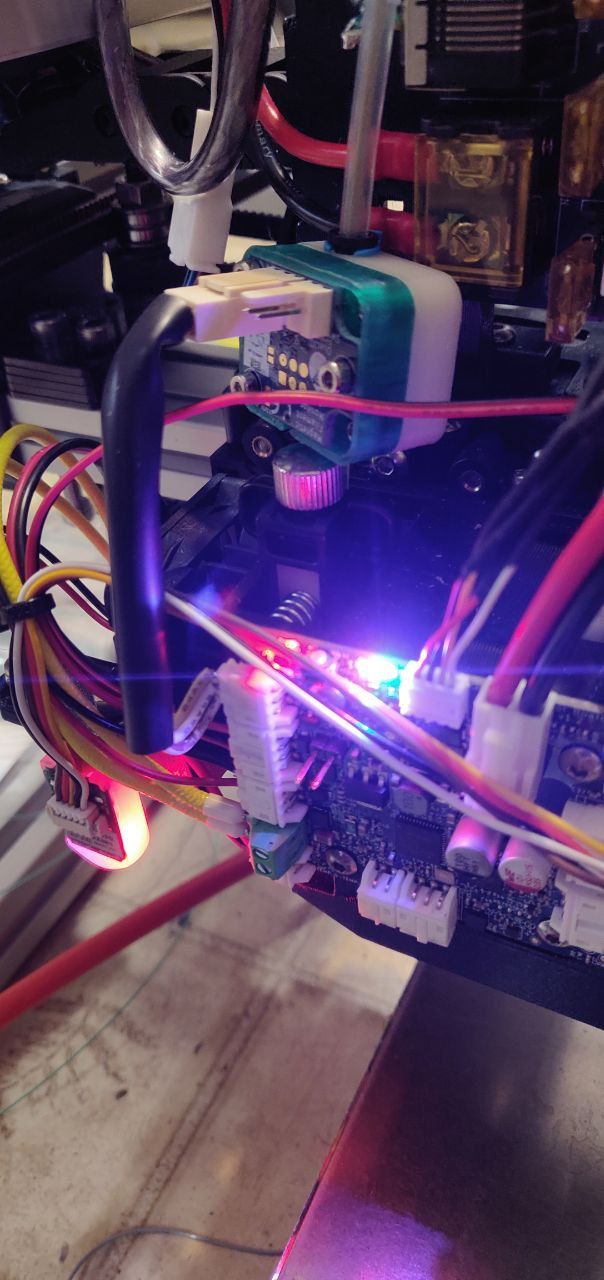
Can you show a photo of how you have it mounted/installed?
When and where did you purchase the sensor?
-
Re wired the sensor and made sure I the connections were solid but just got the error an 74% complete. I bought it from filastruder on January 15th 2022. Here is how it is currently installed.
-
@charliedrums Can You check, if Object Model has correct data for this filament sensor? In my case they do not correspond to what is configured by M591
-
@boa Object model? I kinda lost you there.
-
@charliedrums In DWC:
M591 D0 P3 C"io5.in" S1 L25.4 R50:150 E12.7 A0, so sampleDistance, allowed range and mmPerRev have incorrect value (I think)
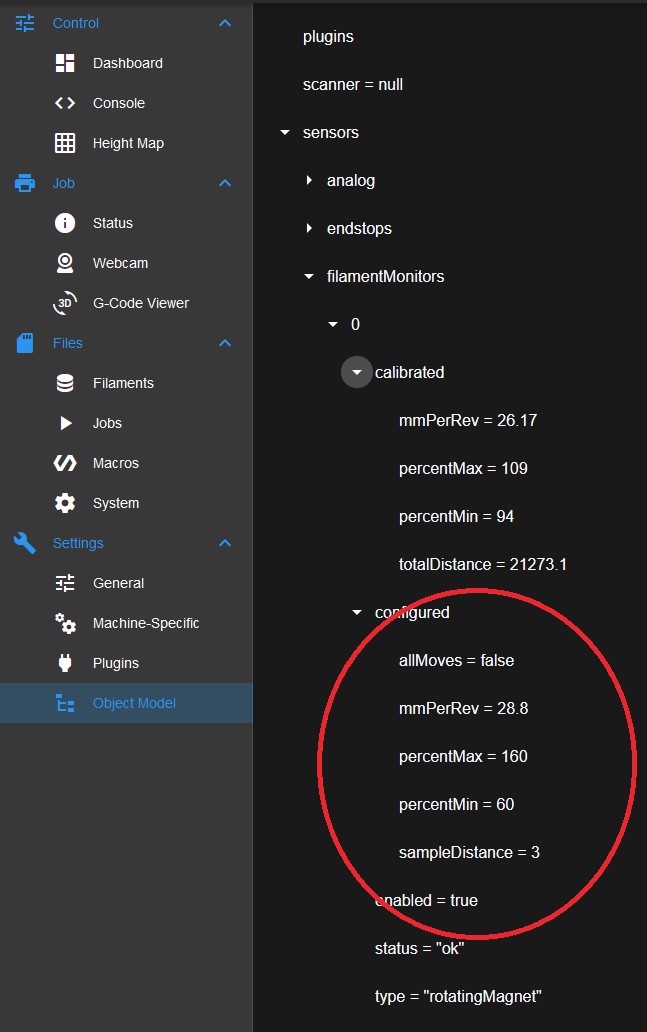
-
@boa Got you. Will do. At work right now but once I get home I'll check it out.
-
@boa I confirm this is a bug: changes to the filament monitor configuration values are not reflected in the OM browser in DWC. They are reported correctly by M409.
-
@boa I don't seem to have that on my DWC
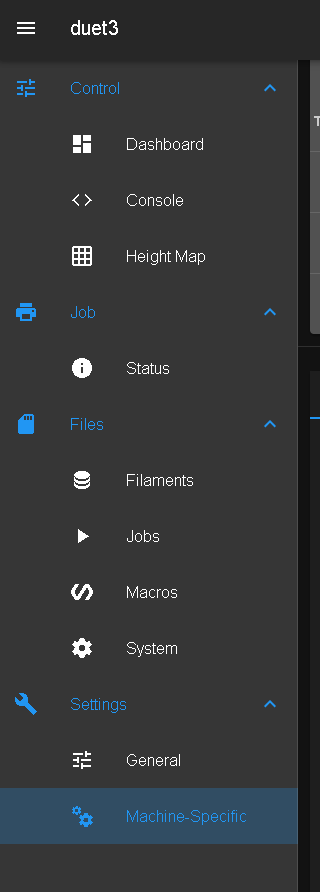
Maybe because I'm running on a SBC (raspberryPi) -
On my last print I had the error occur once and the print took 17h 41m 30s
-
@charliedrums said in RRF3.4 RC2 Filament error on extruder 0: sensorError:
Maybe because I'm running on a SBC (raspberryPi)
The object model browser is a plugin you'd need to load.
@charliedrums said in RRF3.4 RC2 Filament error on extruder 0: sensorError:
On my last print I had the error occur once and the print took 17h 41m 30s
Can you check this thread for an updated housing for the sensor?
This person had good results from the change.
https://forum.duet3d.com/topic/27661/mfm-0-toolittlemovement/9