Data Collection and Reporting for DWC
-
Hello everyone,
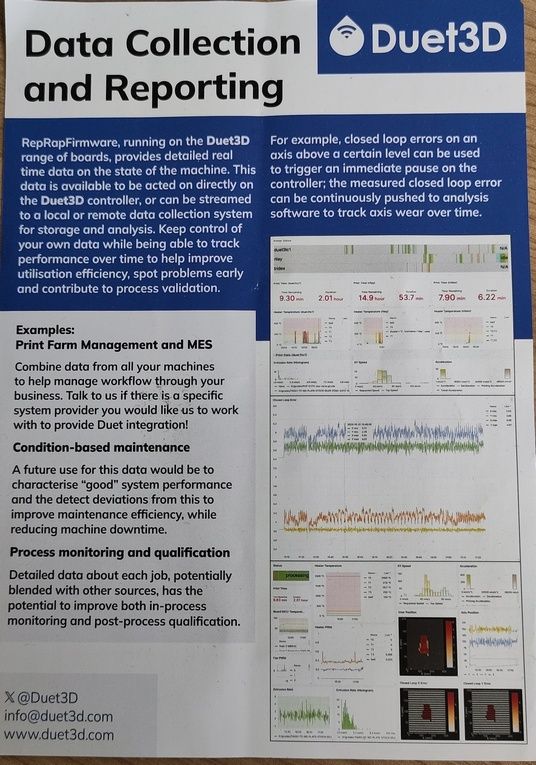
I was at Formnext 2023 in November and took the flyer for data collection and reporting from the Duet3D stand (see the image below). I am currently building an axis system with a measuring system (Duet 3 Expansion 1HCL) and would like to use the visualization of the encoder data, but I can't find anything about it anywhere.
Has anyone already used this or will it only be available in the future?
-
@ErlerPrint3D it was a demo of how it is possible to get information out of the object model. Initial users will probably already have a data collection system for other machines, which could also hook into Duet controlled machines. We have a blog post in draft about how we did the demo and are considering how to expand this for people who don't already have a collection system but want to start doing this.
-
@T3P3Tony
Thank you for your quick reply. I find the visualization of the data very exciting, but I have no idea how to implement it. Can you please send me the link to the blog post.Has anyone from the community already implemented this?
-
@ErlerPrint3D will do when it's published
-
@ErlerPrint3D you can use Node-Red with @MintyTrebor fantastic set of nodes. https://flows.nodered.org/node/node-red-contrib-dsfnode
The data can then be fed into influxdb and visualised with grafana. This can also easily be ran on a raspberry pi on the network.
If you are going to run node-red on a pi, I suggest using this script to install it https://tech.scargill.net/the-script/ It'll also handle the install of grafana and influxdb