Duet Monitoring - Node-red, Prometheus and Grafana
-
Hi Duet3D Forum!
I recently completed a proof of concept using Node-red, the brilliant DSFNode project, Prometheus, and Grafana. My goal was to gain deeper insights and troubleshoot issues with my delta printer, which originated as a Think3dPrint3d Kossel XL kit.
I'm reaching out to see if anyone else has undertaken a similar project. I'd love to either reuse existing insights or, if there's interest, share more details about what I've developed.
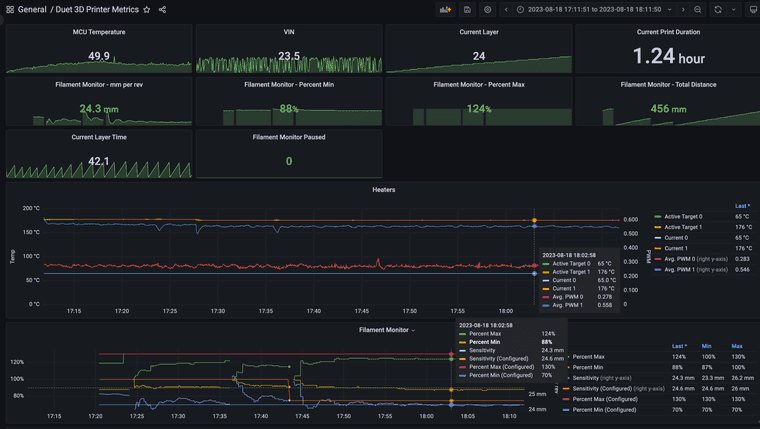
Outcome achieved: Ability to visualise properties of the printer over time:

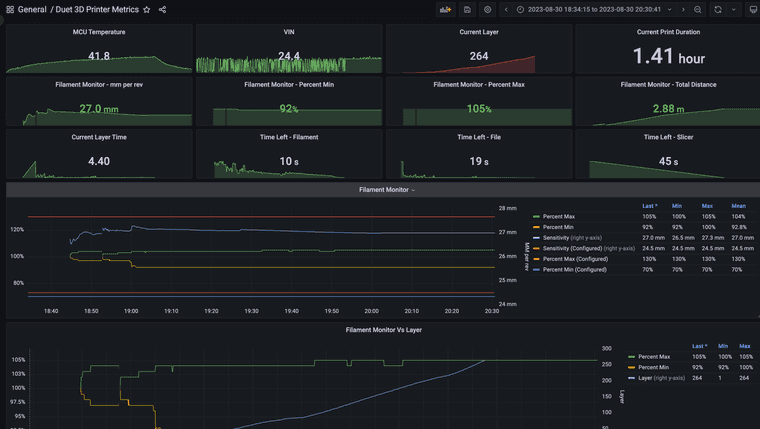
Using this dashboard, I was able to understand how the filament monitor performed during a print. I could contrast the configured sensitivity with the measured one and see that the measured min/max values were nearing the set limits, causing the printer to pause.
I aim to further enhance this to observe how different changes, corresponding to the measurements provided by the filament monitor, manifest. For instance, I'd like to plot acceleration or temperature against max and min values, adjusting them throughout a print. I'm keen on gathering evidence to understand the effect of each tweak I make on the quality.
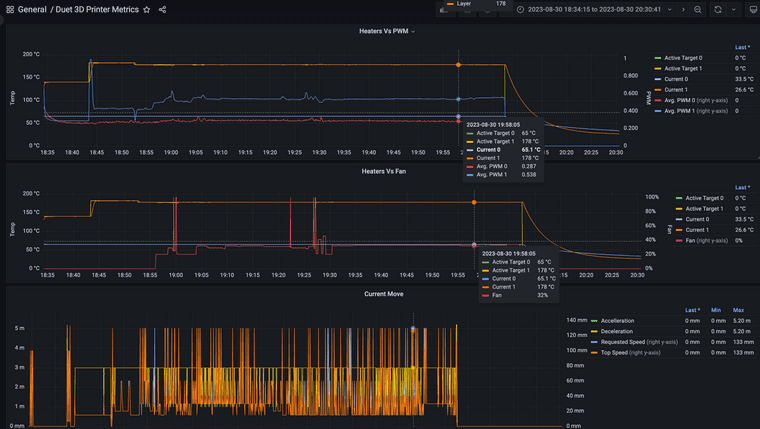
However, several challenges remain. Currently, measurements are taken every 250ms. This frequency might cause aliasing in acceleration/speed measurements, as they might change more rapidly than the metrics are imported into Prometheus & Grafana
How it works: I employ a slightly modified version of DSFNode (in Node-red) that integrates additional queries to the object model to fetch the filament monitor's calibrated attributes. Node-red polls the printer every 250ms, then translates the JSON payload into Prometheus format metric strings. Node-red hosts an HTTP endpoint, delivering the Prometheus format metric strings for Prometheus to scrape. Every 250ms, Prometheus retrieves these metrics. I've configured Grafana to extract data from the Prometheus datasource, and I've set up a dashboard to display the data.
The entire process took only a few hours [so there is much room for improvement!]
Looking forward to hearing if anyone has done something similar!
Dave
-
That's really cool. Well done.
-
@dave-poltorak this is pretty cool! have you explored options for "push" from DSF or node red into a remote time series database that integrates with Grafana (e.g. InfluxDB)?
-
@dave-poltorak said in Duet Monitoring - Node-red, Prometheus and Grafana:
This frequency might cause aliasing in acceleration/speed measurements
Very nice dashboard.
Acceleration and speed of what? Extruder?
This product tracks stepper's steps/microsteps and sends them via bluetooth to an open source Python program. IIRC the reporting rate is at least 20Hz and maybe 50Hz. Does this helps?
-
@dave-poltorak, there are significant fluctuations in the temperature graph. Am I missing something?Ok, I understand, these are the PWM graphs. No problem.
-
@T3P3Tony Thanks for the kind words - and thank you for your patience on my reply

I really do prefer the pull approach - the action of collecting is offloaded to a dedicated tool and configured elsewhere - this has it's own resources which ensures the service that is under observation sees minimal load [and doesn't have to worry about dealing with errors such as `I can't send my metrics anywhere]
It also ensures that the systems stay loosely coupled - can be monitored by multiple systems and if these systems move - is easy to reconfigure in a decentralised way.
What I'm tempted to do is wrap the DSFNode logic into a dedicated runnable so there is minimal footprint - running NodeRed is quite heavy for just this logic.
I use NodeRed to notify me on Discord of errors or problems so I can attend to the printer so it's fine for now - one for the future

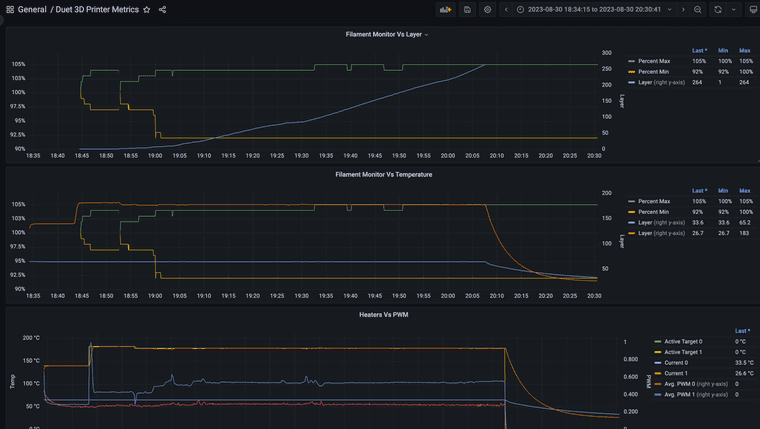
I've upgraded the dashboards a little so will add some new examples below and when time permits - put it all into my Github for others to use - I can imagine this would be really useful for commercial/industrial clients.
-
@zapta Thanks for the links - I'll check them out. I already managed to problem solve my under/over extrusion issues so the dashboards are unlikely to change without needing more information displayed for diagnostics.
I love the level of detail Vector3D goes to - I definitely hope to be able to optimise my printer further with something like this - my next optimisation needs to be print quality
The acceleration/speeds were of commanded moves of all motors - it's not very useful - this is typically always the way when designing these visualisations - you think you know what you want but when you actually look at the outcome achieved - something very different provides the insight you need

-
Dashboards as of now - mostly focussing on filament monitor Vs charts to diagnose extrusion issues [TL;DR - it was pressure advance]
I'll upload the source code to a github repo next week


-
@dave-poltorak
Hi man,
Did you end up publishing your work on Github ?
I'm really interested and would love to have a starting point to work on something similar.
Thanks in advance.