Input Shaping changing with data resolution
-
I just got the Duet3D Accelerometer installed, and in the process of playing with it, I've noticed very inconsistent results in the data collected without any shaping applied. In the interest of taking a slightly scientific approach to this problem, I ran the following move several times with different number of samples:
G1 X45 Y45 G4 S3 M956 P0 S4000 A1 F"9-XY45-135-0-none.csv" G4 P10 G1 X135 Y135 F20000Here are the outputs for the different runs:
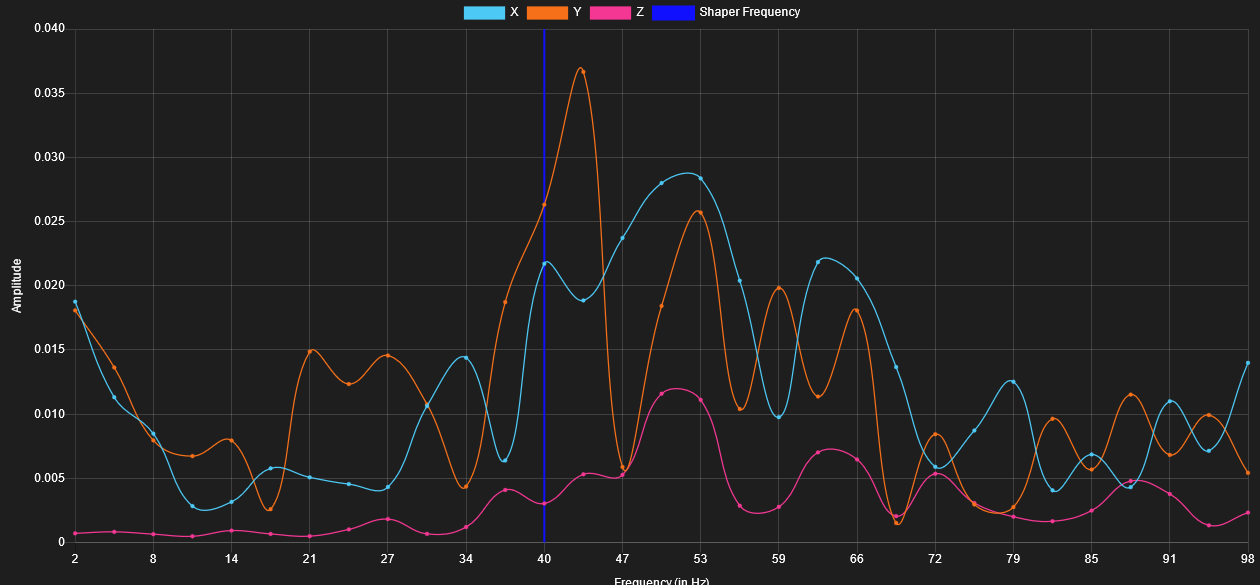
S500:
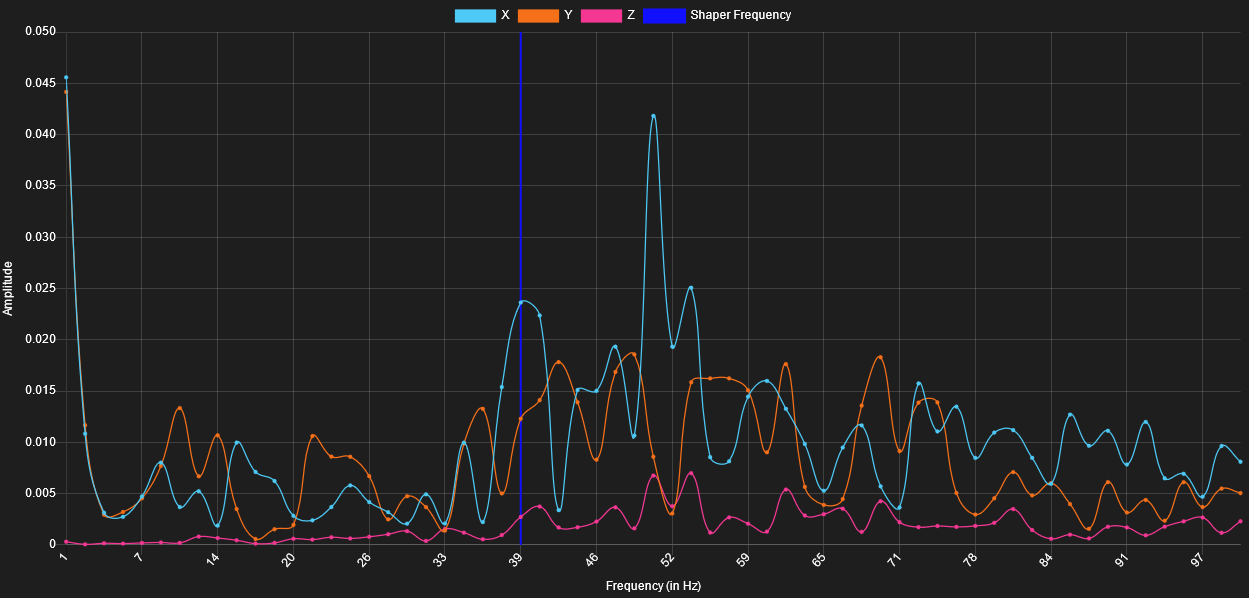
S1000:
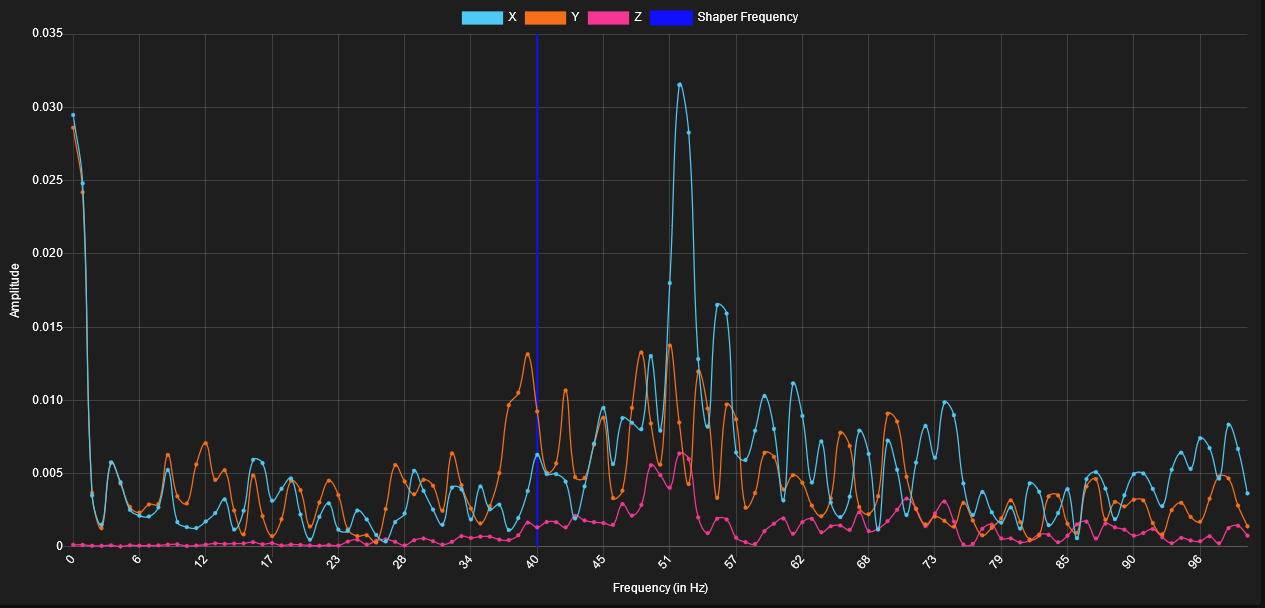
S2000:
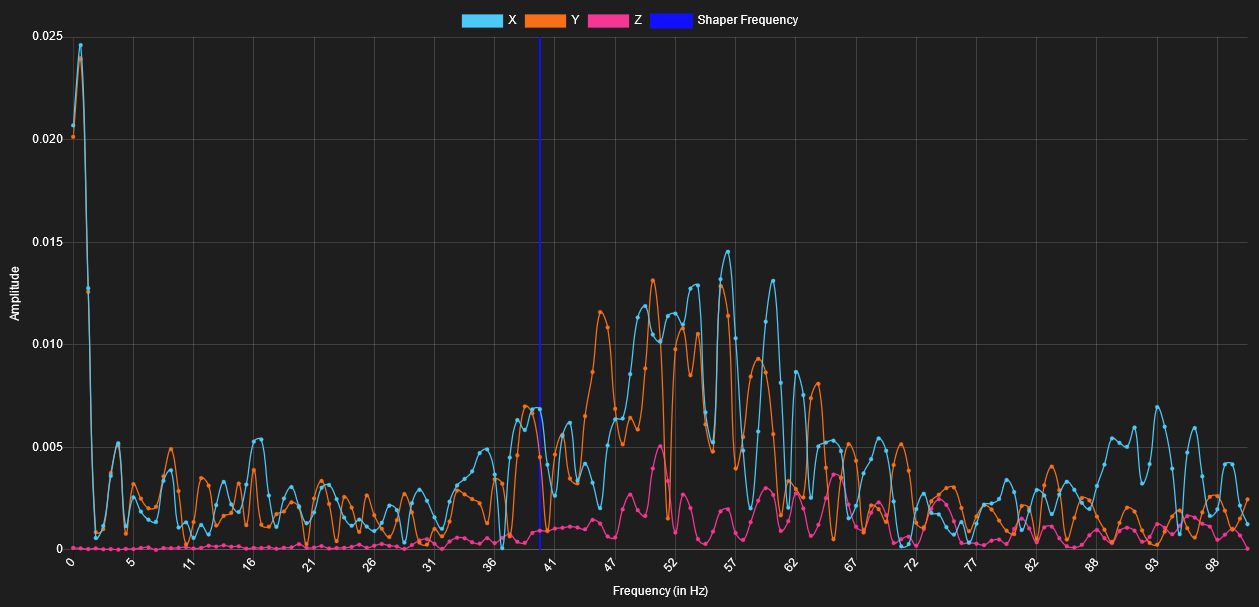
S2500:
S3000:
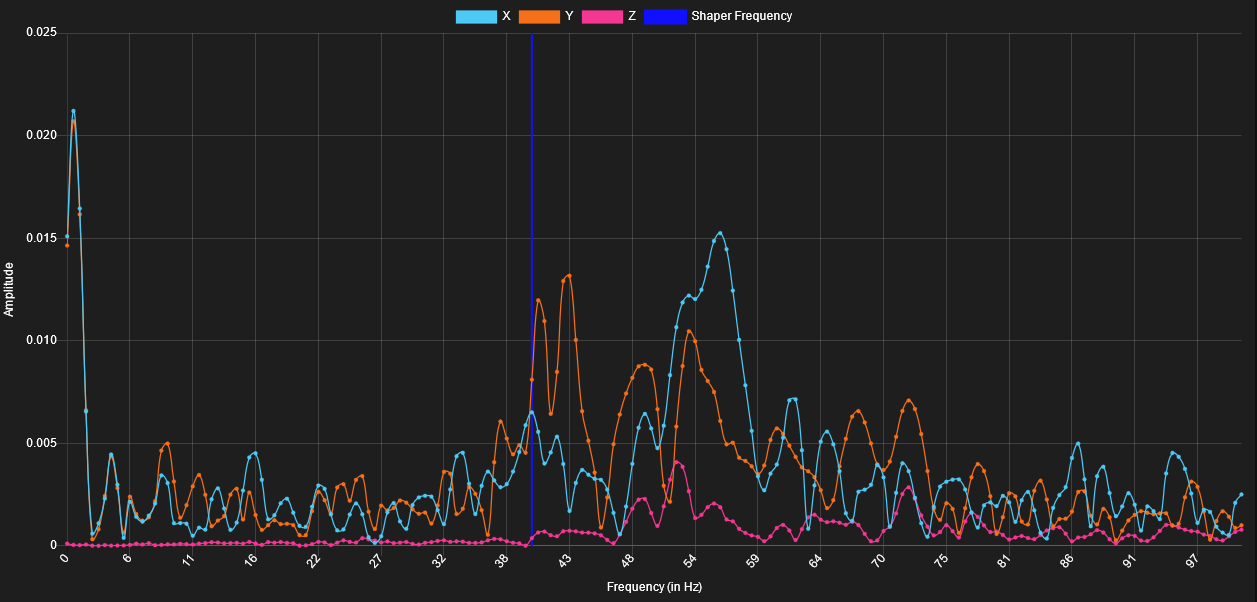
S4000:
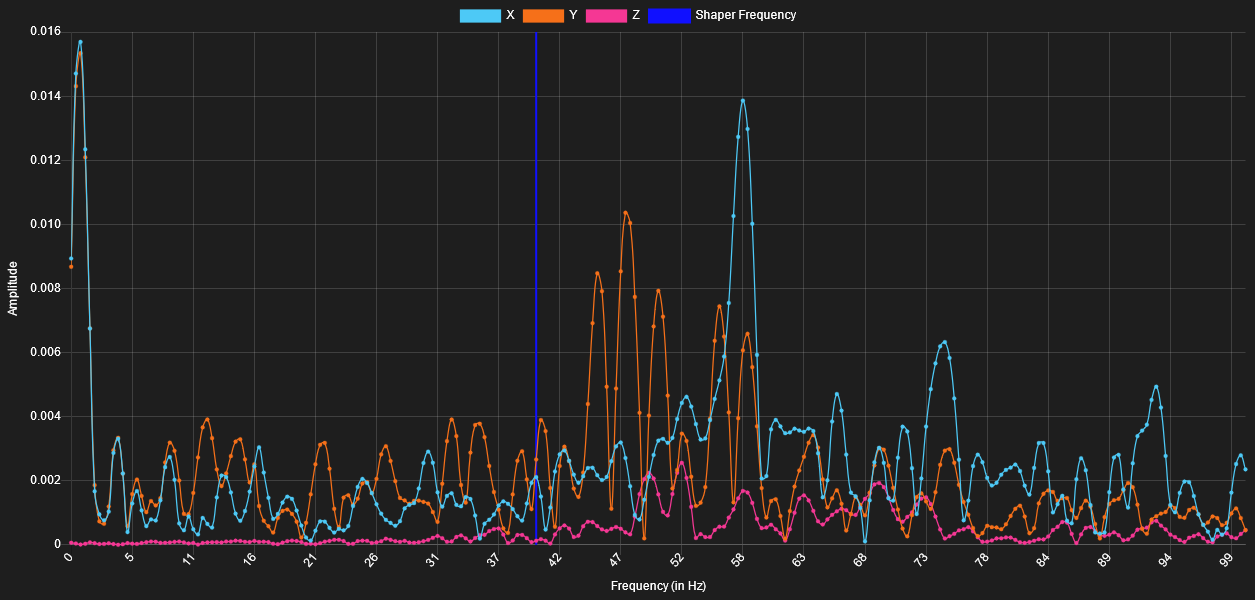
Here is the summary of peak frequency for each axis at each resolution:
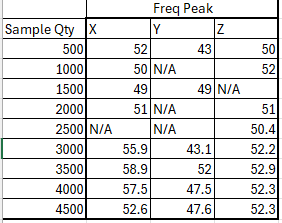
As you can see the amplitude changes a lot with each increase in resolution, and the overall results seem to change a lot with results until I'm above S3000.
I'm not sure what to do with the results at this point. The difference in peak between X and Y does make sense for my printer layout (Dual Wire Gantry, Bowden), but the highly variable results are concerning. Is this going to strongly affect the output of applying input shaping during real prints?
-
@patrickwjoyce Very interested to see where the data leads for this.
I have been running my Accel tests at a fixed 100mm/s and half max accel&jerk because I noticed when testing faster lead to anomalous results. This could be explained as testing twice as fast movements is the equivalent of half as much data resolution per distance traveled. -
@Notepad Interesting. I've got speed, accel, and jerk all basically uncapped at this point with the goal of finding the true limits of my printer, but maybe that's contributing to the variable results.
So I've done more testing with lowered limits, and even still, this is feeling more like a random number generator than a measurement tool. It seems like the cable position is just as significant a factor as the actual motion settings.
-
I reconfigured my setup so that the accelerometer cable is secured to the hot end gantry, and I'm now getting more consistent results. (yay!)
And I think I figured out why the results change with data samples qty. That option doesn't actually change the rate of data points, just the total number of samples. So increasing that number just increases the signficance of ambient vibrations of the system. In my case the fans become the biggest influence.
With Fan
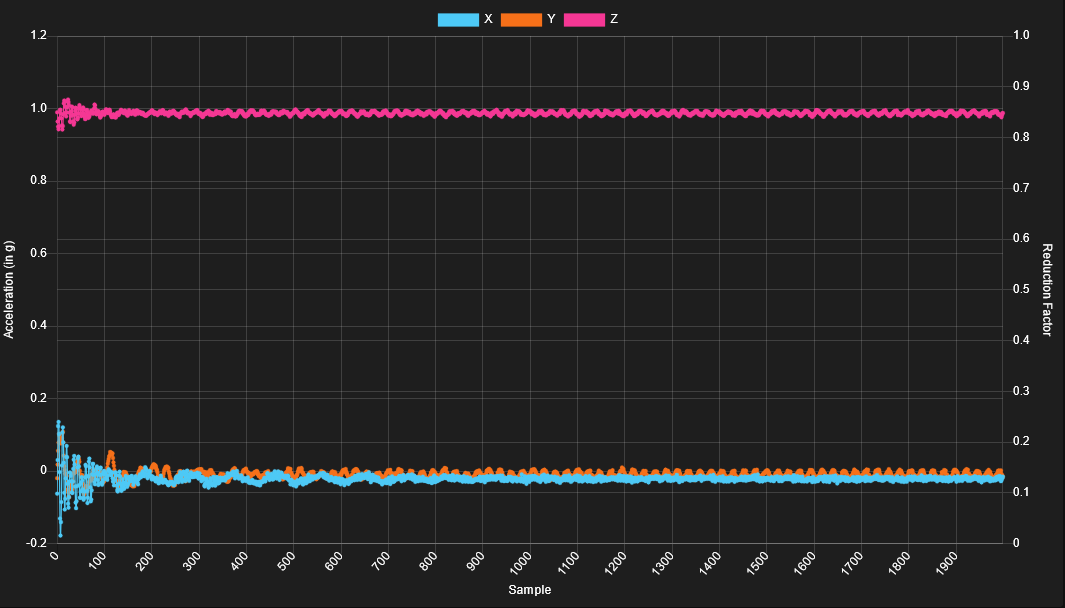
Fan off:
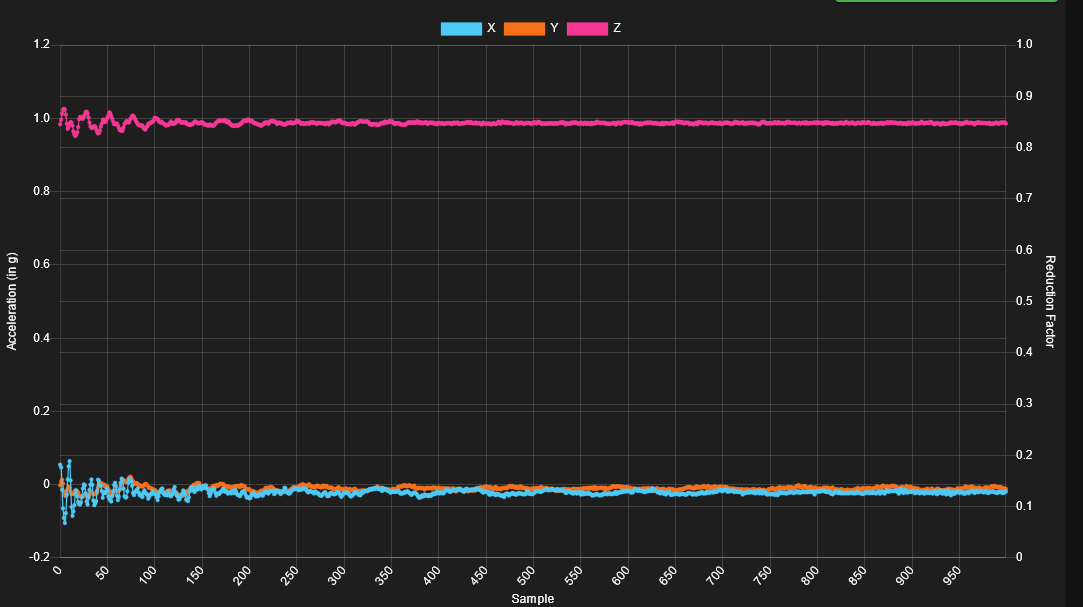
All that being said, I'm now curious if my data is really showing that Input shaping will help me. it seems like my printer is rigid enough that the fans are the primary source of hot end vibration. I'm guess I can try for even more agressive jerk and accelerations until those become relevant.
-
@patrickwjoyce The amplitude of XY is being shrunken by Z being so far away. Not sure why that is. I haven't seen that before.
Without Z the XY data might be in the normal range.
Sorry but I have no idea how to get rid of Z. Someone else probably will.
-
@patrickwjoyce I'm not sure you are increasing the "resolution" by increasing the number of samples. By increasing the number of samples you will just be increasing the time that samples are taken after the move, not the rate at which the samples are taken. Have you looked at the acceleration data? I suspect that beyond some number of samples you will just be collecting a large number of data points with the system at rest. I'm not totally sure what this will be doing to the FFT that is then run on those samples but I could believe that it will be in effect diluting the reading and producing a lower amplitude (and probably a nosier result). If you want to increase the resolution you need to increase the sample frequency. If you do that you may also need to increase the number of samples to ensure the sample period captures all of the useful data.
Just to explain. The way that RRF generates the resonance data is to inject an impulse into the system (by a single higher energy move) then captures the residual accelerations of the system after that impulse. That residual movement will obviously only last a short amount of time, by capturing data beyond the point of the sensitivity of the accelerometer you will not be adding any useful information, but may be adding noise into the result. If you want to increase the number of useful samples you need to increase the sample frequency and/or the sensor resolution. See the M955 S and R settings. If you do that you may also need to increase the number of samples to ensure the sample period captures all of the useful data. However my understanding is that according to Nyquist–Shannon so long as the sample rate is more than twice the highest frequency we are interested in then all of the "useful" data should be being captured.
Note that this way of collecting the data is very different to how for instance Klipper does it. For a discussion of the two methods (and a better description of what RRF is doing than I provided) take a look at this thread:
https://forum.duet3d.com/topic/25975/comparing-klipper-and-rrf-input-shaper-data-collection?_=1716358403125 -
@tas I just assumed that Z was 1 because of gravity. I think that the frequency domain analysis of each axis is done independently since Z shows a very small amplitude in all of my original graphs.
@gloomyandy thank you, I did eventually figure that out. I did check the wiki and firmware, and the accelerometer is already collecting data at the max frequency (1600 hz). And the biggest issue that was occuring with the long tail of data is the hot end cooling fan frequency was creating a false signal.
Regarding my specific case, I was able to solve a lot of my issues by securing the cable to the gantry because the rubbing on the frame was causing lots of noise. And the low amplitude seems to just be from my printer being particularly rigid at the speeds I can go (score 1 for past me!). I'm currently limited by hot end flow rate, so maybe if I switch back to my volcano, this will become more important.