[3.6.0-rc.3] sticky probe with 1HCL board
-
I'm having problems with using a probe connected to a 1HCL board.
Z axis is driven by 1HCL board, Home switch and probe on that board as well.
seemingly random sticky probe issues, where DWC will report the probe status as 1000 with no change until I reboot the mainboard, either with power cycle, M999, or EStop.
Was having these errors on rc2+4, but a lot more frequently. (couldn't get over 100 probes before sticking, and sometimes only a few)
I thought rc2+5 fixed them, as it ran my macro in it's entirety once (over 5000 probes) without the probe sticking, directly after installing the update. But subsequent tries all failed before finishing, though usually much further along than I'd get with 2+4.
Installed rc3, hoping it would act the same as when I installed the 2+5 (ie, complete at least a full run without sticking) but it has not. the probe stuck around the 180th probe.Currently in Closed Loop mode, tuned to my system. Though I intend to do testing with open Loop as well as G38.2 instead of G30, to see if there's differences there.
Breakdown of the order the following log snippet
successful probe with position recorded,
M122 B50.0 (macro called)
successful probe with position recorded,
subsequent probe due to position being out of my set range between probe instances
Probe stuck in a triggered state, my macro then cycled out (does multiple probes and only accepts if position is within set range, if too many out of range, shutdown)
confirmed probe was not faulty by unplugging probe from board, status stayed at 1000.
Reconnected probe to the board.
I then ran G31 to show probe state,
M122 on main board
M122 on 1HCL (address 50)
rebooted 1HCL (M999 B50.0)
G31,
M122
M122 B50.0
M999 to reboot the main board,
when DWC reconnected then the probe status reset to 0 -
2025-05-01 09:52:08 [debug] Stopped at height -0.110 mm
2025-05-01 09:52:08 [info] currentZPosition:-0.109939
2025-05-01 09:52:08 [info] tubeContactPos:-0.1104854 contactPositions:{-0.109,-0.111,-0.110,0,0,0,0,0,0,0} Success Two Point Average at 1 touches
2025-05-01 09:52:08 [debug] Diagnostics for board 50:
2025-05-01 09:52:08 [debug] Duet EXP1HCL rev 1.0a or earlier firmware version 3.6.0-rc.3 (2025-04-29 14:20:58)
Bootloader ID: SAME5x bootloader version 2.4 (2021-12-10)
All averaging filters OK
2025-05-01 09:52:08 [debug] Never used RAM 51300, free system stack 170 words
Tasks: EncCal(1,nWait 6,0.0%,469) Move(3,nWait 7,0.0%,99) CLSend(3,nWait 6,0.0%,149) TMC(4,nWait 6,71.6%,313) HEAT(2,nWait 6,0.1%,105) CanAsync(5,nWait 4,4.0%,66) CanRecv(3,nWait 1,0.0%,31) CanClock(5,nWait 1,0.0%,63) MAIN(1,running,22.8%,249) IDLE(0,ready,0.0%,29) AIN(2,nWait 2,1.4%,255), total 100.0%
Owned mutexes:
Last reset 00:10:01 ago, cause: software
2025-05-01 09:52:08 [debug] Last software reset time unknown, reason: HardFault zeroDiv, available RAM 51444, slot 2
Software reset code 0x0060 HFSR 0x40000000 CFSR 0x02000000 ICSR 0x00000803 BFAR 0xe000ed38 SP 0x20002cc0 Task TMC Freestk 366 ok
2025-05-01 09:52:08 [debug] Stack: 00000000 20002d2f 00000000 00000000 00000000 00026359 00026368 41000000 0018a715 00024de3 20019948 20019948 00000001 00025d53 00025d3d 2001a874 001ceac9 00027c73 01601008 a0180030 08004d84 41c31e52 05c80021 3a341809 002ad181 2001a7c0 001ceac9
2025-05-01 09:52:08 [debug] Moves scheduled 822, hiccups 0 (0.00/0.00ms), segs 3, step errors 0 (types 0x0), maxLate 0 maxPrep 236, ebfmin 0.00 max 0.00
Phase step loop runtime (us): min=6, max=532, frequency (Hz): min=611, max=15306
Sync err accum 63, peak jitter -2/0, peak Rx delay 175, resyncs 0/0, no timer interrupt scheduled, next step interrupt due in 3968593204 ticks, disabled
VIN voltage: min 24.4, current 24.4, max 24.4
V12 voltage: min 12.2, current 12.2, max 12.2
MCU temperature: min 32.5C, current 33.4C, max 33
2025-05-01 09:52:08 [debug] Driver 0: pos -5225, 10060.2 steps/mm, ok, SG min n/a, mspos 296, reads 42733, writes 11 timeouts 1
2025-05-01 09:52:08 [debug] Last sensors broadcast 0x00000000 found 0 124 ticks ago, 0 ordering errs, loop time 1
CAN messages queued 131, send timeouts 0, received 42, lost 0, ignored 0, errs 0, boc 0, free buffers 38, min 38, error reg 0
dup 0, oos 0/0/0/0, rxMotionDelay 701, adv 36058/37093
2025-05-01 09:52:08 [debug] Closed loop driver 0 mode: closed loop, pre-error threshold: 7.50, error threshold: 50.00, encoder type linearComposite, position 1233
Shaft: Encoder reverse polarity: yes, full rotations 3, last angle 11958, minCorrection=-15.4, maxCorrection=10.9, agc 15, mag 4606, no error
Lin: Encoder reverse polarity: no, raw count 1242
Tuning mode: 0, tuning error: 0, collecting data: no
Accelerometer: none
I2C bus errors 0, naks 0, contentions 0, other errors 0
2025-05-01 09:52:09 [debug] Stopped at height -0.108 mm
2025-05-01 09:52:09 [info] currentZPosition:-0.108149
2025-05-01 09:52:10 [warn] Error: G30: Probe already triggered at start of probing move
2025-05-01 09:52:10 [info] currentZPosition:-0.105664
2025-05-01 09:52:10 [warn] Error: G30: Probe already triggered at start of probing move
2025-05-01 09:52:10 [info] currentZPosition:-0.103080
2025-05-01 09:52:10 [warn] Error: G30: Probe already triggered at start of probing move
2025-05-01 09:52:10 [info] currentZPosition:-0.100495
2025-05-01 09:52:10 [warn] Error: G30: Probe already triggered at start of probing move
2025-05-01 09:52:10 [info] currentZPosition:-0.0979110
2025-05-01 09:52:10 [warn] Error: G30: Probe already triggered at start of probing move
2025-05-01 09:52:10 [info] currentZPosition:-0.0953266
2025-05-01 09:52:11 [info] tubeContactPos:-0.1104854 contactPositions:{-0.108,-0.106,-0.103,-0.100,-0.0979,-0.0953,0,0,0,0} Failed 5 touches
2025-05-01 09:52:11 [debug] Done printing file
2025-05-01 09:52:11 [debug] Done printing file
2025-05-01 09:52:11 [warn] Cancelled printing file 0:/gcodes/NV00044073A.g, print time was 0h 7m
2025-05-01 09:52:11 [debug] Unable to get consistent touch location: {-0.108,-0.106,-0.103,-0.100,-0.0979,-0.0953,0,0,0,0} contactSpread: -0.0128 FiveContact Accept: 0.0025400
2025-05-01 09:52:18 [warn] Ethernet running, IP address = 192.168.1.14
2025-05-01 09:52:27 [warn] HTTP client 192.168.1.2 login succeeded (session key 2970616275)
2025-05-01 09:53:02 [debug] Z probe 0: current reading 1000, threshold 500, trigger height 0.000, offsets X0.0 Y0.0 A0.0 B0.0
2025-05-01 09:53:16 [debug] === Diagnostics ===
RepRapFirmware for Duet 3 Mini 5+ version 3.6.0-rc.3 (2025-04-30 14:42:33) running on Duet 3 Mini5plus Ethernet (standalone mode)
Board ID: G5729-TU8LU-F65J0-409NU-3F03Z-7U6T6
2025-05-01 09:53:16 [debug] Used output buffers: 1 of 40 (35 max)
2025-05-01 09:53:16 [debug] === RTOS ===
Static ram: 94764
Dynamic ram: 117988 of which 0 recycled
Never used RAM 28524, free system stack 136 words
Tasks: NETWORK(1,ready,28.8%,173) ETHERNET(5,nWait 7,0.2%,569) HEAT(3,nWait 6,0.0%,357) Move(4,nWait 6,0.0%,241) TMC(4,nWait 6,0.8%,65) CanReceiv(6,nWait 1,0.0%,766) CanSender(5,nWait 7,0.0%,325) CanClock(7,delaying,0.0%,346) MAIN(1,running,69.2%,631) IDLE(0,ready,0.2%,29) USBD(3,blocked,0.0%,147) AIN(4,delaying,0.8%,261), total 100.0%
Owned mutexes:
2025-05-01 09:53:16 [debug] === Platform ===
Last reset 00:11:01 ago, cause: software
2025-05-01 09:53:16 [debug] Last software reset at 2025-05-01 07:50, reason: User, Gcodes spinning, available RAM 28696, slot 2
Software reset code 0x0003 HFSR 0x00000000 CFSR 0x00000000 ICSR 0x00000000 BFAR 0xe000ed38 SP 0x00000000 Task MAIN Freestk 0 n/a
2025-05-01 09:53:16 [debug] Error status: 0x00
2025-05-01 09:53:16 [debug] MCU temperature: min 33.0, current 38.4, max 39.1
Supply voltage: min 23.7, current 23.9, max 24.1, under voltage events: 0, over voltage events: 0, power good: yes
2025-05-01 09:53:16 [debug] Heap OK, handles allocated/used 99/37, heap memory allocated/used/recyclable 2048/1664/964, gc cycles 224
Events: 1 queued, 1 completed
2025-05-01 09:53:16 [debug] Date/time: 2025-05-01 09:53:16
Slowest loop: 138.70ms; fastest: 0.16ms
2025-05-01 09:53:16 [debug] === Storage ===
Free file entries: 19
SD card 0 detected, requested/actual speed: 25.0/24.0MBytes/sec
SD card longest read time 4.6ms, write time 137.2ms, max retries 0
2025-05-01 09:53:16 [debug] === Move ===
Segments created 8, maxWait 153583ms, bed comp in use: none, height map offset 0.000, hiccups added 0/0 (0.00/0.00ms), max steps late 1, ebfmin 0.00, ebfmax 0.00
Pos req/act/dcf: 0.00/0/0.00 149786.00/149786/0.00 4098.00/4097/0.41 570.00/570/0.00 477093.00/477093/0.00
No step interrupt scheduled
2025-05-01 09:53:16 [debug] Driver 0: standstill, SG min 2, r/w errs 0/1, ifcnt 34, reads/writes 34792/16, timeouts 0, DMA errs 0, CC errs 0
Driver 1: standstill, SG min 6, r/w errs 0/1, ifcnt 34, reads/writes 34791/16, timeouts 0, DMA errs 0, CC errs 0
Driver 2: standstill, SG min 0, r/w errs 0/1, ifcnt 34, reads/writes 34791/16, timeouts 0, DMA errs 0, CC errs 0
Driver 3: standstill, SG min 0, r/w errs 0/1, ifcnt 21, reads/writes 34797/10, timeouts 0, DMA errs 0, CC errs 0
2025-05-01 09:53:16 [debug] Driver 4: standstill, SG min 0, r/w errs 0/1, ifcnt 21, reads/writes 34798/10, timeouts 0, DMA errs 0, CC errs 0
Driver 5: not present
Driver 6: not present
2025-05-01 09:53:16 [debug] === DDARing 0 ===
Scheduled moves 1355, completed 1355, LaErrors 0, Underruns [0, 0, 0]
Segments left 0, axes/extruders owned 0x00000007, drives owned 0x00000007
Code queue is empty
=== DDARing 1 ===
Scheduled moves 0, completed 0, LaErrors 0, Underruns [0, 0, 0]
Segments left 0, axes/extruders owned 0x00000000, drives owned 0x00000000
Code queue is empty
2025-05-01 09:53:16 [debug] === Heat ===
Bed heaters -1 -1 -1 -1, chamber heaters -1 -1 -1 -1, ordering errs 0
2025-05-01 09:53:16 [debug] === GCodes ===
Movement locks held by null, null
HTTP is idle in state(s) 0
Telnet is idle in state(s) 0
File is idle in state(s) 0
USB is idle in state(s) 0
Aux is idle in state(s) 0
Trigger is idle in state(s) 0
Queue is idle in state(s) 0
LCD is idle in state(s) 0
SBC is idle in state(s) 0
Daemon is idle in state(s) 0
Aux2 is idle in state(s) 0
Autopause is idle in state(s) 0
File2 is idle in state(s) 0
Queue2 is idle in state(s) 0
2025-05-01 09:53:16 [debug] === CAN ===
Messages queued 6109, received 19733, lost 0, ignored 0, errs 1, boc 0
Longest wait 265ms for reply type 6041, peak Tx sync delay 411, free buffers 26 (min 25), ts 3136/3135/0
Tx timeouts 0,0,0,0,0,0
2025-05-01 09:53:16 [debug] === Network ===
Slowest loop: 96.37ms; fastest: 0.03ms
Responder states: MQTT(0) HTTP(0) HTTP(0) HTTP(0) HTTP(0) FTP(0) Telnet(0)
HTTP sessions: 1 of 8
2025-05-01 09:53:16 [debug] = Ethernet =
Interface state: active
Error counts: 0 0 0 0 0 0
Socket states: 6 2 2 2 2 0 0 0 0
2025-05-01 09:53:22 [debug] Diagnostics for board 50:
2025-05-01 09:53:22 [debug] Duet EXP1HCL rev 1.0a or earlier firmware version 3.6.0-rc.3 (2025-04-29 14:20:58)
Bootloader ID: SAME5x bootloader version 2.4 (2021-12-10)
All averaging filters OK
2025-05-01 09:53:22 [debug] Never used RAM 51300, free system stack 170 words
Tasks: EncCal(1,nWait 6,0.0%,469) Move(3,nWait 7,0.0%,99) CLSend(3,nWait 6,0.0%,149) TMC(4,nWait 6,73.1%,313) HEAT(2,nWait 6,0.1%,105) CanAsync(5,nWait 4,0.1%,66) CanRecv(3,nWait 1,0.0%,31) CanClock(5,nWait 1,0.0%,63) MAIN(1,running,25.5%,249) IDLE(0,ready,0.0%,29) AIN(2,nWait 2,1.3%,255), total 100.0%
Owned mutexes:
Last reset 00:11:16 ago, cause: software
2025-05-01 09:53:22 [debug] Last software reset time unknown, reason: HardFault zeroDiv, available RAM 51444, slot 2
Software reset code 0x0060 HFSR 0x40000000 CFSR 0x02000000 ICSR 0x00000803 BFAR 0xe000ed38 SP 0x20002cc0 Task TMC Freestk 366 ok
2025-05-01 09:53:22 [debug] Stack: 00000000 20002d2f 00000000 00000000 00000000 00026359 00026368 41000000 0018a715 00024de3 20019948 20019948 00000001 00025d53 00025d3d 2001a874 001ceac9 00027c73 01601008 a0180030 08004d84 41c31e52 05c80021 3a341809 002ad181 2001a7c0 001ceac9
2025-05-01 09:53:22 [debug] Moves scheduled 833, hiccups 0 (0.00/0.00ms), segs 3, step errors 0 (types 0x0), maxLate 0 maxPrep 237, ebfmin 0.00 max 0.00
Phase step loop runtime (us): min=6, max=417, frequency (Hz): min=692, max=15306
Sync err accum 92, peak jitter -3/3, peak Rx delay 183, resyncs 0/0, next timer interrupt due in 1 ticks, enabled, next step interrupt due in 3912662750 ticks, disabled
VIN voltage: min 24.4, current 24.4, max 24.4
V12 voltage: min 12.2, current 12.2, max 12.2
MCU temperature: min 32.5C, curre
2025-05-01 09:53:22 [debug] Driver 0: pos -18, 10060.2 steps/mm, ok, SG min n/a, mspos 296, reads 18238, writes 28 timeouts 2
2025-05-01 09:53:22 [debug] Last sensors broadcast 0x00000000 found 0 196 ticks ago, 0 ordering errs, loop time 0
CAN messages queued 659, send timeouts 0, received 378, lost 0, ignored 0, errs 0, boc 0, free buffers 38, min 38, error reg 0
dup 0, oos 0/0/0/0, rxMotionDelay 390, adv 36216/37126
2025-05-01 09:53:22 [debug] Closed loop driver 0 mode: closed loop, pre-error threshold: 7.50, error threshold: 50.00, encoder type linearComposite, position 4
Shaft: Encoder reverse polarity: yes, full rotations 2, last angle 1648, minCorrection=-15.4, maxCorrection=10.9, agc 15, mag 4633, no error
Lin: Encoder reverse polarity: no, raw count 4
Tuning mode: 0, tuning error: 0, collecting data: no
Accelerometer: none
I2C bus errors 0, naks 0, contentions 0, other errors 0
2025-05-01 09:53:33 [debug] Board 50 resetting
2025-05-01 09:53:34 [warn] Error: Expansion board 50 reconnected
2025-05-01 09:53:40 [debug] Z probe 0: current reading 1000, threshold 500, trigger height 0.000, offsets X0.0 Y0.0 A0.0 B0.0
2025-05-01 09:53:47 [debug] === Diagnostics ===
RepRapFirmware for Duet 3 Mini 5+ version 3.6.0-rc.3 (2025-04-30 14:42:33) running on Duet 3 Mini5plus Ethernet (standalone mode)
Board ID: G5729-TU8LU-F65J0-409NU-3F03Z-7U6T6
2025-05-01 09:53:47 [debug] Used output buffers: 1 of 40 (35 max)
2025-05-01 09:53:47 [debug] === RTOS ===
Static ram: 94764
Dynamic ram: 117988 of which 0 recycled
Never used RAM 28524, free system stack 136 words
Tasks: NETWORK(1,ready,24.8%,173) ETHERNET(5,nWait 7,0.2%,569) HEAT(3,nWait 6,0.0%,357) Move(4,nWait 6,0.0%,241) TMC(4,nWait 6,0.8%,65) CanReceiv(6,nWait 1,0.0%,766) CanSender(5,nWait 7,0.0%,325) CanClock(7,delaying,0.0%,337) MAIN(1,running,73.4%,631) IDLE(0,ready,0.0%,29) USBD(3,blocked,0.0%,147) AIN(4,delaying,0.8%,261), total 100.0%
Owned mutexes:
2025-05-01 09:53:47 [debug] === Platform ===
Last reset 00:11:32 ago, cause: software
2025-05-01 09:53:47 [debug] Last software reset at 2025-05-01 07:50, reason: User, Gcodes spinning, available RAM 28696, slot 2
Software reset code 0x0003 HFSR 0x00000000 CFSR 0x00000000 ICSR 0x00000000 BFAR 0xe000ed38 SP 0x00000000 Task MAIN Freestk 0 n/a
2025-05-01 09:53:47 [debug] Error status: 0x00
2025-05-01 09:53:47 [debug] MCU temperature: min 37.8, current 37.8, max 38.4
Supply voltage: min 23.9, current 23.9, max 24.0, under voltage events: 0, over voltage events: 0, power good: yes
2025-05-01 09:53:47 [debug] Heap OK, handles allocated/used 99/37, heap memory allocated/used/recyclable 2048/1664/964, gc cycles 224
Events: 2 queued, 2 completed
2025-05-01 09:53:47 [debug] Date/time: 2025-05-01 09:53:47
Slowest loop: 84.39ms; fastest: 0.17ms
2025-05-01 09:53:47 [debug] === Storage ===
Free file entries: 19
SD card 0 detected, requested/actual speed: 25.0/24.0MBytes/sec
SD card longest read time 3.3ms, write time 4.6ms, max retries 0
2025-05-01 09:53:47 [debug] === Move ===
Segments created 8, maxWait 0ms, bed comp in use: none, height map offset 0.000, hiccups added 0/0 (0.00/0.00ms), max steps late 0, ebfmin 0.00, ebfmax 0.00
Pos req/act/dcf: 0.00/0/0.00 149786.00/149786/0.00 4098.00/4097/0.41 570.00/570/0.00 477093.00/477093/0.00
No step interrupt scheduled
2025-05-01 09:53:47 [debug] Driver 0: standstill, SG min 16, r/w errs 0/0, ifcnt 34, reads/writes 1625/0, timeouts 0, DMA errs 0, CC errs 0
Driver 1: standstill, SG min 14, r/w errs 0/0, ifcnt 34, reads/writes 1626/0, timeouts 0, DMA errs 0, CC errs 0
Driver 2: standstill, SG min 14, r/w errs 0/0, ifcnt 34, reads/writes 1625/0, timeouts 0, DMA errs 0, CC errs 0
Driver 3: standstill, SG min 0, r/w errs 0/0, ifcnt 21, reads/writes 1625/0, timeouts 0, DMA errs 0, CC errs 0
2025-05-01 09:53:47 [debug] Driver 4: standstill, SG min 0, r/w errs 0/0, ifcnt 21, reads/writes 1625/0, timeouts 0, DMA errs 0, CC errs 0
Driver 5: not present
Driver 6: not present
2025-05-01 09:53:47 [debug] === DDARing 0 ===
Scheduled moves 1355, completed 1355, LaErrors 0, Underruns [0, 0, 0]
Segments left 0, axes/extruders owned 0x00000007, drives owned 0x00000007
Code queue is empty
=== DDARing 1 ===
Scheduled moves 0, completed 0, LaErrors 0, Underruns [0, 0, 0]
Segments left 0, axes/extruders owned 0x00000000, drives owned 0x00000000
Code queue is empty
2025-05-01 09:53:47 [debug] === Heat ===
Bed heaters -1 -1 -1 -1, chamber heaters -1 -1 -1 -1, ordering errs 0
2025-05-01 09:53:47 [debug] === GCodes ===
Movement locks held by null, null
HTTP is idle in state(s) 0
Telnet is idle in state(s) 0
File is idle in state(s) 0
USB is idle in state(s) 0
Aux is idle in state(s) 0
Trigger is idle in state(s) 0
Queue is idle in state(s) 0
LCD is idle in state(s) 0
SBC is idle in state(s) 0
Daemon is idle in state(s) 0
Aux2 is idle in state(s) 0
Autopause is idle in state(s) 0
File2 is idle in state(s) 0
Queue2 is idle in state(s) 0
2025-05-01 09:53:47 [debug] === CAN ===
Messages queued 156, received 286, lost 0, ignored 0, errs 3093, boc 0
Longest wait 14ms for reply type 6024, peak Tx sync delay 25123, free buffers 26 (min 25), ts 146/143/0
Tx timeouts 0,0,3,0,0,0 last cancelled message type 30 dest 127
2025-05-01 09:53:47 [debug] === Network ===
Slowest loop: 4.67ms; fastest: 0.04ms
Responder states: MQTT(0) HTTP(0) HTTP(0) HTTP(0) HTTP(0) FTP(0) Telnet(0)
HTTP sessions: 1 of 8
2025-05-01 09:53:47 [debug] = Ethernet =
Interface state: active
Error counts: 0 0 0 0 0 0
Socket states: 6 2 2 2 2 0 0 0 0
2025-05-01 09:53:52 [debug] Diagnostics for board 50:
2025-05-01 09:53:52 [debug] Duet EXP1HCL rev 1.0a or earlier firmware version 3.6.0-rc.3 (2025-04-29 14:20:58)
Bootloader ID: SAME5x bootloader version 2.4 (2021-12-10)
All averaging filters OK
2025-05-01 09:53:52 [debug] Never used RAM 81348, free system stack 180 words
Tasks: Move(3,nWait 7,0.0%,181) CLSend(3,nWait 6,0.0%,149) TMC(2,nWait 6,24.6%,349) HEAT(2,nWait 6,0.0%,130) CanAsync(5,nWait 4,0.0%,70) CanRecv(3,nWait 1,0.0%,79) CanClock(5,nWait 1,0.0%,68) MAIN(1,running,71.2%,425) IDLE(0,ready,3.4%,29) AIN(2,nWait 2,0.8%,263), total 100.0%
Owned mutexes:
Last reset 00:00:18 ago, cause: software
2025-05-01 09:53:52 [debug] Last software reset time unknown, reason: HardFault zeroDiv, available RAM 51444, slot 2
Software reset code 0x0060 HFSR 0x40000000 CFSR 0x02000000 ICSR 0x00000803 BFAR 0xe000ed38 SP 0x20002cc0 Task TMC Freestk 366 ok
2025-05-01 09:53:52 [debug] Stack: 00000000 20002d2f 00000000 00000000 00000000 00026359 00026368 41000000 0018a715 00024de3 20019948 20019948 00000001 00025d53 00025d3d 2001a874 001ceac9 00027c73 01601008 a0180030 08004d84 41c31e52 05c80021 3a341809 002ad181 2001a7c0 001ceac9
2025-05-01 09:53:52 [debug] Moves scheduled 0, hiccups 0 (0.00/0.00ms), segs 0, step errors 0 (types 0x0), maxLate 0 maxPrep 0, ebfmin 0.00 max 0.00
Phase step loop runtime (us): min=0, max=97, frequency (Hz): min=0, max=37500
Sync err accum 70, peak jitter -3/5, peak Rx delay 180, resyncs 0/0, next timer interrupt due in 6 ticks, enabled, next step interrupt due in 4281075752 ticks, disabled
VIN voltage: min 24.4, current 24.4, max 24.4
V12 voltage: min 12.2, current 12.2, max 12.2
MCU temperature: min 33.4C, current 33.4
2025-05-01 09:53:52 [debug] Driver 0: pos 0, 80.0 steps/mm, standstill, SG min n/a, mspos 296, reads 27049, writes 11 timeouts 0
2025-05-01 09:53:52 [debug] Last sensors broadcast 0x00000000 found 0 146 ticks ago, 0 ordering errs, loop time 0
CAN messages queued 172, send timeouts 0, received 93, lost 0, ignored 0, errs 0, boc 0, free buffers 38, min 38, error reg 0
dup 0, oos 0/0/0/0, rxMotionDelay 0
2025-05-01 09:53:52 [debug] Closed loop driver 0 mode: open loop, pre-error threshold: 2.00, error threshold: 4.00, encoder type none
Accelerometer: none
I2C bus errors 12, naks 0, contentions 0, other errors 0
2025-05-01 09:53:58 [info] Event logging stopped
power up + 00:00:03 [info] Event logging started at level debug
power up + 00:00:03 [info] Running: Duet 3 Mini5plus Ethernet: 3.6.0-rc.3 (2025-04-30 14:42:33)
power up + 00:00:03 [debug] Done!
power up + 00:00:03 [debug] RepRapFirmware for Duet 3 Mini 5+ is up and running.
power up + 00:00:05 [warn] Ethernet running, IP address = 192.168.1.14
power up + 00:00:07 [warn] HTTP client 192.168.1.2 login succeeded (session key 2691985074)
2025-05-01 09:54:07 [warn] Date and time set at power up + 00:00:07
2025-05-01 09:54:12 [debug] Z probe 0: current reading 0, threshold 500, trigger height 0.000, offsets X0.0 Y0.0 A0.0 B0.0
2025-05-01 09:54:24 [warn] Ethernet running, IP address = 192.168.1.14
2025-05-01 09:54:32 [warn] HTTP client 192.168.1.2 login succeeded (session key 2837175574)
Too long of post, had to split
-
Did multiple more tests, all of the combinations of:
OpenLoop:ClosedLoop
G30:G38.2
MainBoard:1HCL (probe connection)MainBoard connected would get through my test without once sticking the probe.
1HCL connected always stuck the probe, but at random times. The most # of probes I was able to get through before the probe stuck was 781.Also tried slowing down the probing speed, and playing with the pullback (M558 H###:####). none had noticeable affect in time before sticking, though it's so random it's hard to identify what makes a difference or what is just placebo.
-
@ironhydroxide what was the latest 3.6.x version you used that you think didn't have this issue?
Duet WiFi hardware designer and firmware engineer
Please do not ask me for Duet support via PM or email, use the forum
http://www.escher3d.com, https://miscsolutions.wordpress.com -
@dc42 I don't think there was one, though I didn't exhaustively test.
I think I was on 3.6.0-beta3 when I first setup the system with initial tests. It happened on that version and I went searching and found mentioned it wasn't recommended to probe from a can Board. I swapped it to the mainboard and continued my testing, upping versions as I saw them released.
I revisited the probe on Can board when my testing showed a significant skew in where the machine thought was vs where it really should be (my post in the general discussion page) and when testing for that found that the 3.6.0-rc2+5 ran one complete cycle of my test without sticking, and the dissonance in real vs machine position was much improved. But since that Single cycle completed successfully I have not been able to manage another without sticky probe if the probe is on the 1HCL.
I can go through the versions I have saved (beta3, beta4, rc1, rc1+1-3, rc2, rc2+1-5, rc3) and test them progressively if that would help.
-
@dc42 Tested every firmware I had downloaded. Each and every one at one time stuck the probe when connected to the 1HCL board. eventlog for each is titled it's firmware name. Zip file has event logs, as well as the spreadsheets I used to evaluate the trends.
Doing all this testing has shown me that it'd be MUCH simpler to check the machine position skew vs the encoder if the encoder ticks were available in the object model, instead of having to run an M122, and after the fact run the log through a python script, pulling out the ticks. Is this something that's fairly easily doable? or a huge change to the firmware?
Test setup:
1HCL running Z axis in Open Loop
Probe on 1HCL input 1
Probe Macro using G30 with F0.363255:0.0363255 speeds
config.g config.gsetZeroDepth.g set zero macro.
findContact.g find contact macro.
no changes in macros or cycle between firmwares.
Results from testing:
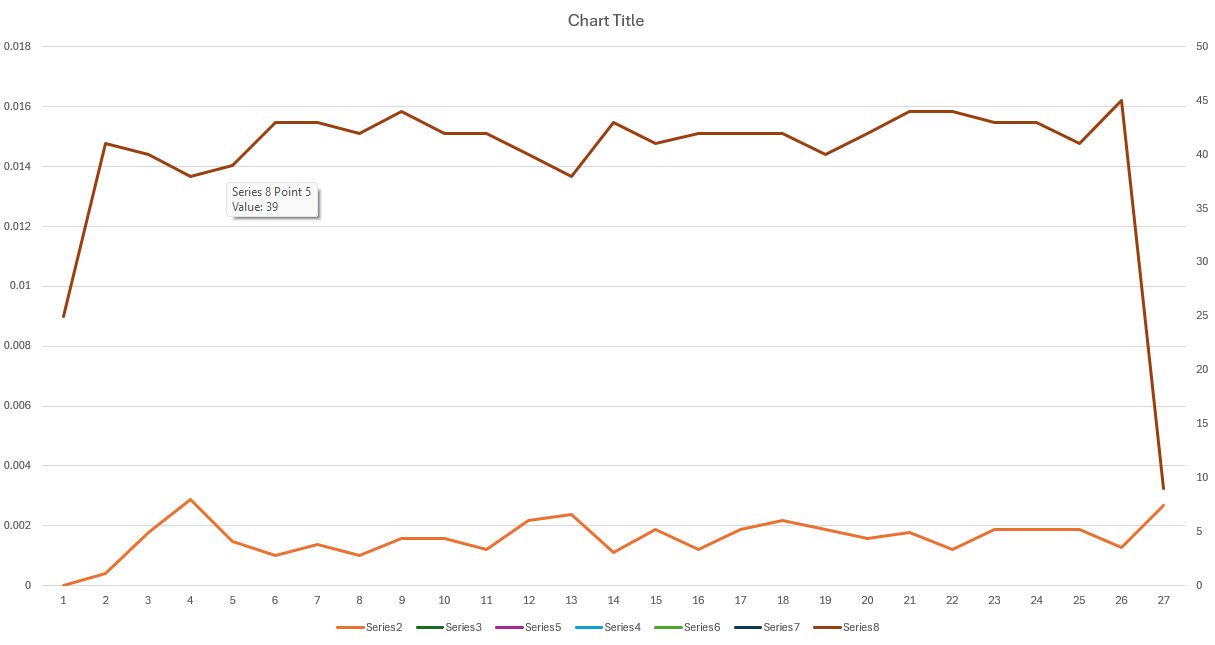
3.6.0-beta3: one single probe successful, subsequent probes "probe already triggered at start of probing move" Probe stuck at 1000 until main board reboot.3.6.0-beta4: set zero macro successful (probe at 4 points on tube, average position, set average as machine zero), 6 probes succeed, then probe stuck at 1000 till main board reboot. (total 11 probes before sticking)
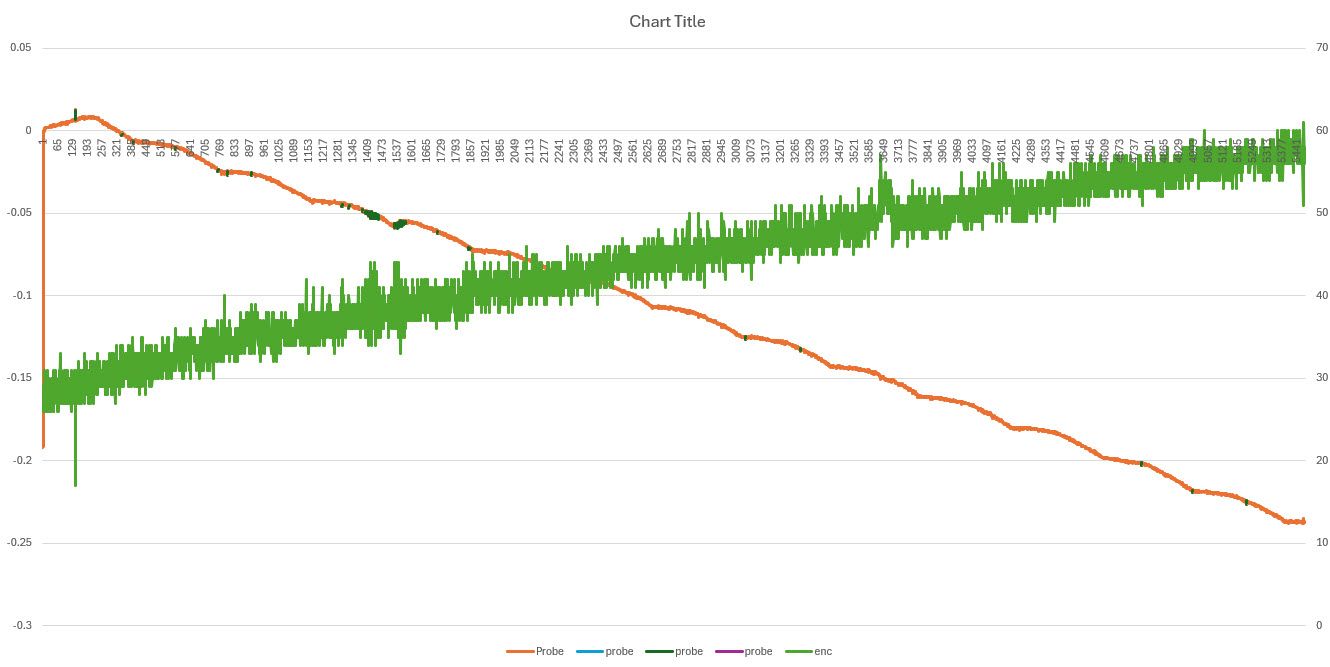
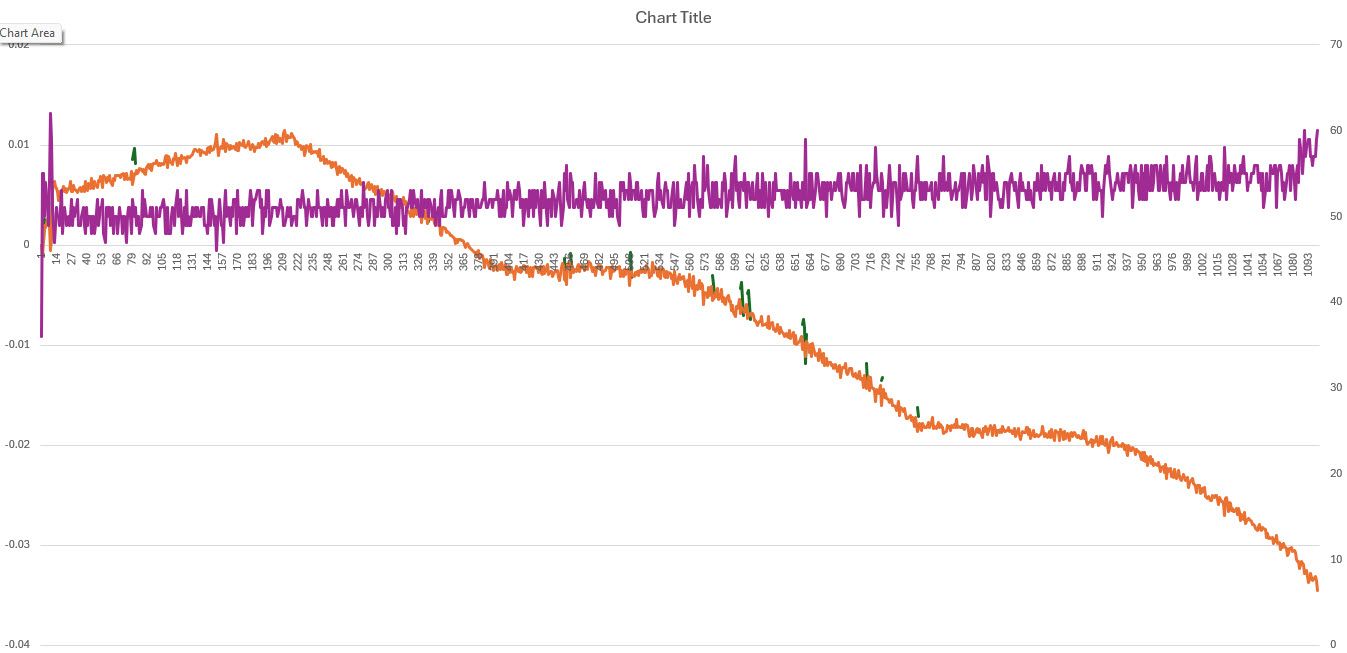
3.6.0-rc1: 2498 probes successful before probe sticking. Probe positions trended up for 120 probes before inverting and trending down for the remainder, while the encoder values trend up fairly consistently (note, encoder tick values are inverse to position, as ticks go up, z goes negative. at a rate of 0.00168mm/tick, or 594.3ticks/mm)
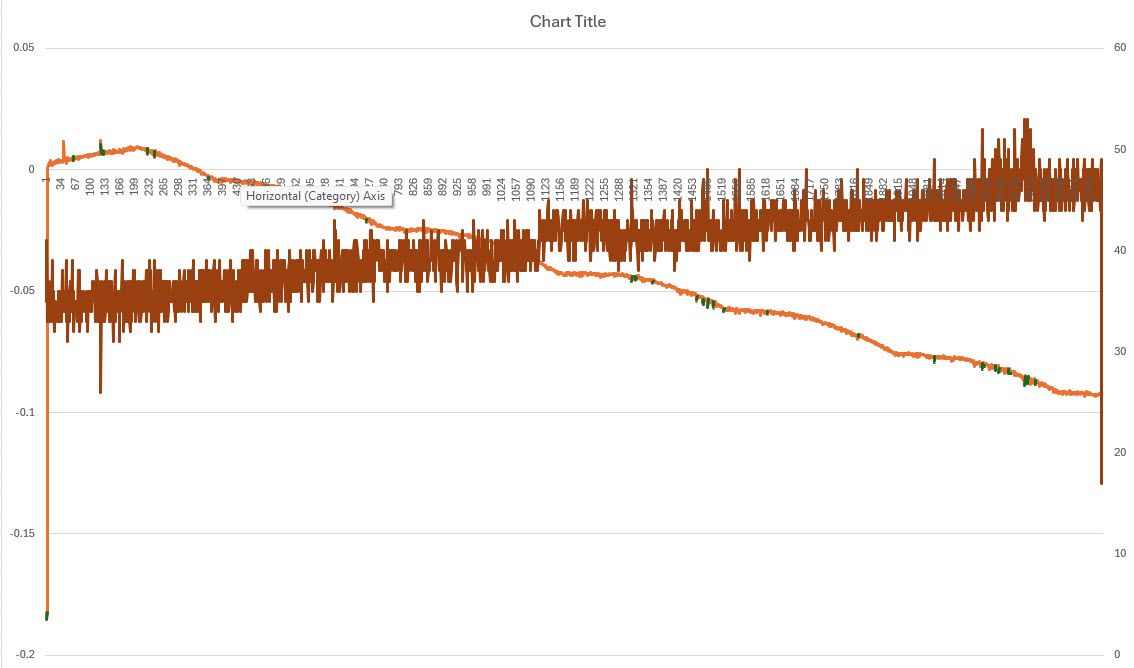
3.6.0-rc1+1: full cycle successful without sticking (5696 probes), Probe positions trended up for ~200 probes before inverting and trending down for the remainder. curiously the downwards trend is in a repeating bumpy fashion with a period of ~300-400 probes. I notice now that the previous test (3.6.0-rc1) showed the same bumpy ~300-400 period drift. Difference in start vs end in machine position -0.237mm, difference start vs end in ticks 34. Meaning that the machine position should have drifted -0.05712mm if we trust the ticks on the encoder. this is about 1/4 the drift the machine position shows.
3.6.0-rc1+1 2: Ran the cycle again to see if it'd complete a second time. 954 probes successful before probe sticking (6650 probes total since powerup/cycle). Again noticed upwards trend till ~200 probes, then downwards at the same "bumpy" ~300-400 probe cycle until probe stick (can barely see 1.5 bumps before shutdown).
3.6.0-rc1+2: 225 probes before sticking. machine position trending up before probe stuck.
3.6.0-rc1+3: 1163 probes before my macro shut down the cycle due to too much variance in probe positions. Probe trend upwards till ~200, then bumpy downwards is still present.
3.6.0-rc1+3 2: 287 probes before sticking (1450 probes total since powerup/cycle). Probe trend upwards till ~150, then downwards before sticky probe.

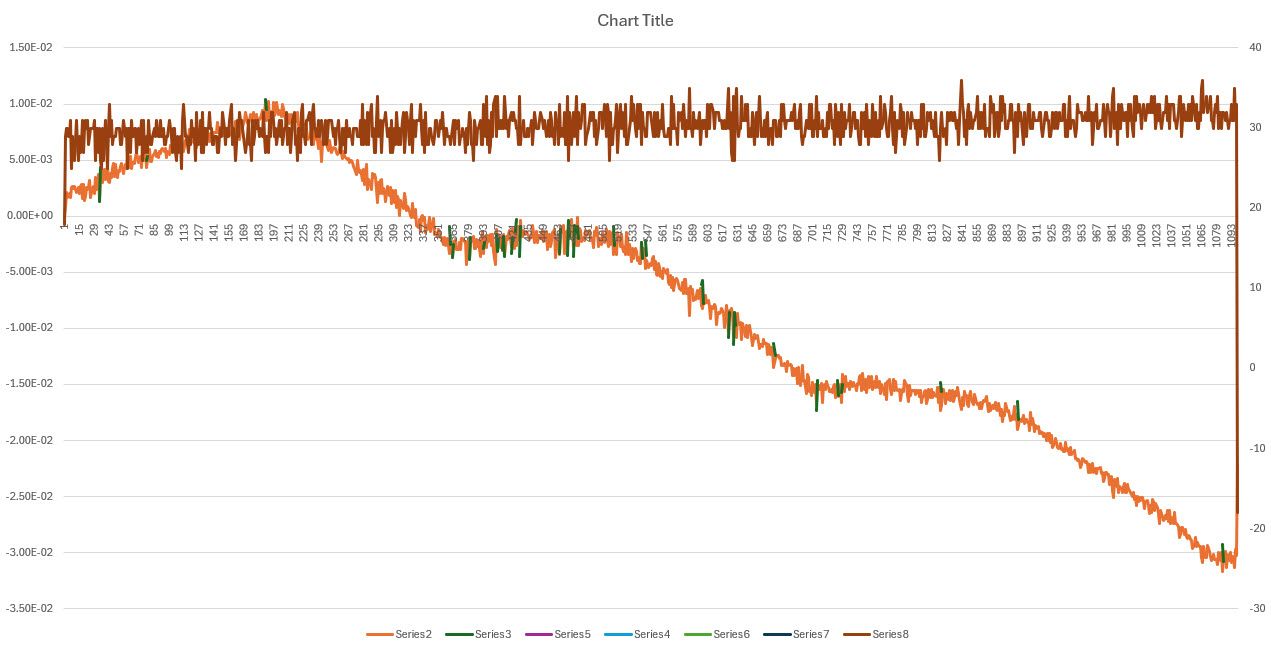
3.6.0-rc2:1881 probes before sticking. Probe again trends upwards till ~200, then trends downwards on the ~300-400 probe bumpyness, though there are 2 points where the probe shifts significantly ~0.008mm between probes, when the encoder ticks differs by ~2.

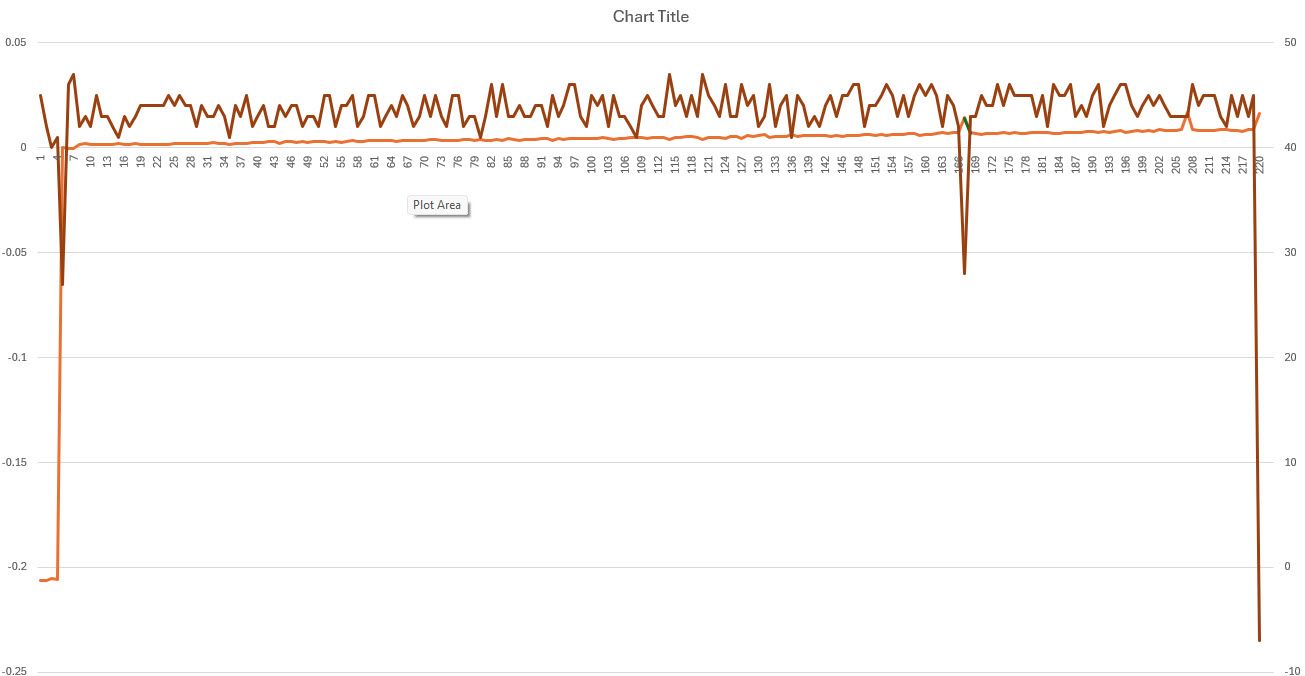
3.6.0-rc2+1: 34 probes before sticking. Not much data to trend, but even still seem to be shifting upwards.
3.6.0-rc2+4: 403 probes before sticking. Again upwards trend till ~200, then downwards trend.

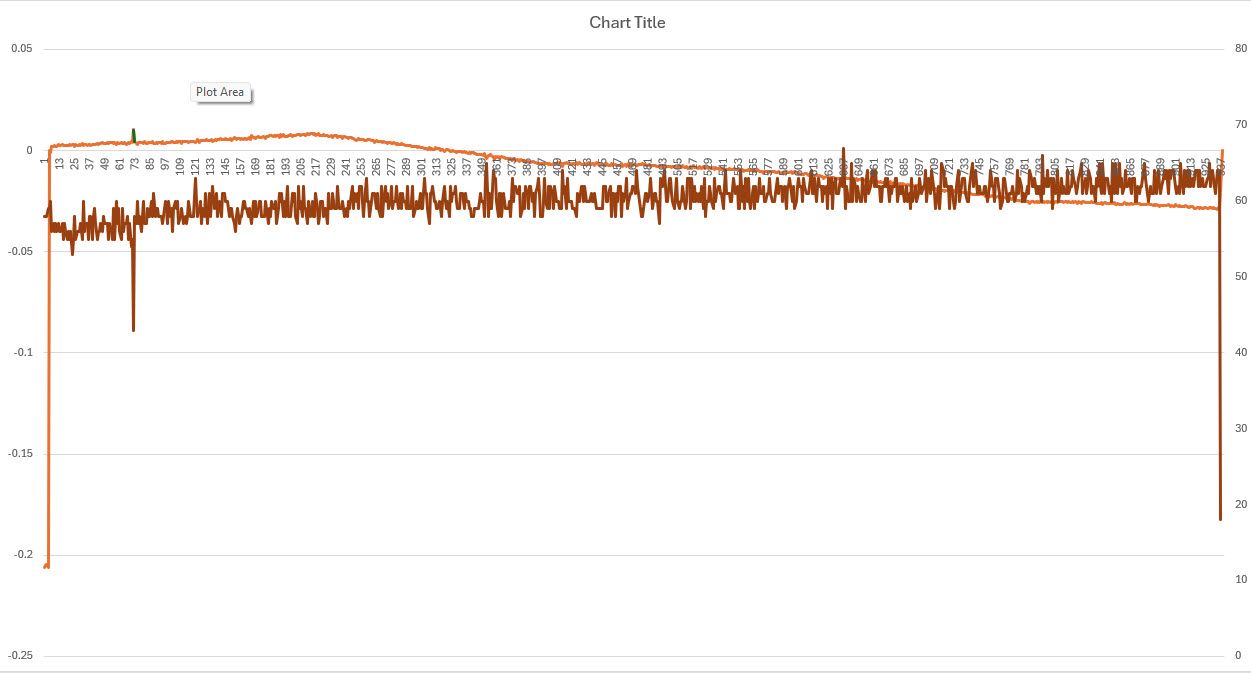
3.6.0-rc2+5: 475 probes before sticking. Upwards trend until ~160, then downwards trend leveling off ~340.

3.6.0-rc3: 1232 probes before sticking. Upwards trend till ~200, downwards bumpy trend at 300-400 cadence.
Here's the Zip of all the Logs and Excel files, download and change the extension to .zip instead of .txt
3.6.0Tests.txt -
@ironhydroxide thanks for your comprehensive testing!
-
What type of probe is it: BLTouch, simple switch, or something else?
-
Please confirm that this a new system that you have only run 3.6 beta/RC versions on, and you haven't previously had it working using 3.5.x firmware.
Duet WiFi hardware designer and firmware engineer
Please do not ask me for Duet support via PM or email, use the forum
http://www.escher3d.com, https://miscsolutions.wordpress.com -
-
@ironhydroxide further to my previous message, please execute the following commands both before the probe has stuck and after it has stuck, in each case with the probe not triggered and then with the probe triggered, and report the outputs:
M122 B50 P1007 A{0x40002800} R16
M122 B50 P1007 A{0x41008000} R16Duet WiFi hardware designer and firmware engineer
Please do not ask me for Duet support via PM or email, use the forum
http://www.escher3d.com, https://miscsolutions.wordpress.com -
@dc42 it's a "simple switch" In that it's a conductive blade on an electrically isolated spindle,
And yes, it's a new system I'm working through feasibility on using the Duet for our fleet of machines.The tube is connected to the probe ground pin,
The spindle is connected to the input pin, inverted input, with pullup enabled.When the two connect, the voltage drops and the probe is triggered.
I'll add those commands to my macro and test.
-
@dc42 I added:
M118 P0 S{"PreTrigger: "^sensors.probes[0].value[0]} L2
M122 B50 P1007 A{0x40002800} R16
M122 B50 P1007 A{0x41008000} R16
just before calling G30 in my probe macro,
Then after probe position is "accepted" (probe should still be triggered as Z hasn't moved since G30)M118 P0 S{"ProbeTriggered: "^sensors.probes[0].value[0]} L2 M122 B50 P1007 A{0x40002800} R16 M122 B50 P1007 A{0x41008000} R16and then ran the test again.
I noticed the system shut down much more often due to my probe macro not accepting probe points close enough together, than previous tests. Not sure why a log and diagnostic output command could cause that, as I'd think it wouldn't affect anything in the movement or probe interrupt....
I also noticed while running, that the outputs when the probe shouldn't be triggered (pre trigger) often showed probe status of 1000, but didn't error on the G30 command that runs right after, but also often showed status of 0...
And as for the inverse, on the output that should be "triggered" the probe was often reported with status 0, and ONLY reported status 1000 once. though this one I can see that maybe the blade removed enough material to no longer be in contact with the tube in the time between the probe cycle finishing, and my log command running..... though I'd assume that to be microseconds, not milliseconds.after 3 shutdowns due to my macro, the probe stuck on the 4th running.
I confirmed probe stuck, then ran in the consoleM118 P0 S{"Probe Stuck, Probe definitely not triggered: "^sensors.probes[0].value[0]} L2 M122 B50 P1007 A{0x40002800} R16 M122 B50 P1007 A{0x41008000} R16then lowered my z by 0.05 (definitely contacting my tubing, ie triggered) and ran
M118 P0 S{"Probe Stuck, Probe definitely triggered: "^sensors.probes[0].value[0]} L2 M122 B50 P1007 A{0x40002800} R16 M122 B50 P1007 A{0x41008000} R16in the excel, the really low encoder tick points and low probe positions are where I restarted the macro, and it has to go through the findzero macro.
as for the outputs. Directly before probe stuck I got this, (pulled from the log file attached above)
2025-05-09 07:57:09 [info] ProbeTriggered: 0
2025-05-09 07:57:09 [debug] Address 0x40002800: 00000002 00000000 00000000 00002008 00002008 00000000 00000000 0000b000 00b00000 00000000 00000000 00000000 00000000 00000000 00000000 00000000
2025-05-09 07:57:09 [debug] Address 0x41008000: c8040422 c8040422 c8040422 c8040422 08142401 08142401 08142401 08142401 089d3701 00000000 00000000 00000000 01011100 00022022 88002022 07000066
2025-05-09 07:57:10 [info] PreTrigger: 0
2025-05-09 07:57:10 [debug] Address 0x40002800: 00000002 00000000 00000000 00002008 00002008 00000000 00000000 0000b000 00b00000 00000000 00000000 00000000 00000000 00000000 00000000 00000000
2025-05-09 07:57:10 [debug] Address 0x41008000: c8040422 c8040422 c8040422 c8040422 08142401 08142401 08142401 08142401 0a953f01 00000000 00000000 00000000 01011100 00022022 88002022 07000066
........
2025-05-09 07:57:43 [info] PreTrigger: 1000
2025-05-09 07:57:43 [debug] Address 0x40002800: 00000002 00000000 00000000 00002008 00002008 00000000 00000000 0000b000 00b00000 00000000 00000000 00000000 00000000 00000000 00000000 00000000
2025-05-09 07:57:43 [debug] Address 0x41008000: c8040422 c8040422 c8040422 c8040422 00142401 00142401 00142401 00142401 00953f01 00000000 00000000 00000000 01011100 00022022 88002022 07000066
And after stuck here's the outputs of the untriggered, and triggered (of course, in the file above as well)
2025-05-09 07:59:06 [info] Probe Stuck, Probe definitely not triggered 1000 2025-05-09 07:59:06 [debug] Address 0x40002800: 00000002 00000000 00000000 00002008 00002008 00000000 00000000 0000b000 00b00000 00000000 00000000 00000000 00000000 00000000 00000000 00000000 2025-05-09 07:59:06 [debug] Address 0x41008000: c8040422 c8040422 c8040422 c8040422 48142401 48142401 48142401 48142401 4a9d3f01 00000000 00000000 00000000 01011100 00022022 88002022 07000066 2025-05-09 08:00:02 [info] Probe Stuck, Probe definitely triggered 1000 2025-05-09 08:00:02 [debug] Address 0x40002800: 00000002 00000000 00000000 00002008 00002008 00000000 00000000 0000b000 00b00000 00000000 00000000 00000000 00000000 00000000 00000000 00000000 2025-05-09 08:00:02 [debug] Address 0x41008000: c8040422 c8040422 c8040422 c8040422 40142401 40142401 40142401 40142401 419d3f01 00000000 00000000 00000000 01011100 00022022 88002022 07000066 -
@ironhydroxide thank you for your reports.
I am having difficulty interpreting them. Your config.g file uses this M558 line:
M558 P8 C"!50.io1.in" H1:0.00254 F2.425:0.0363255 T100 K0 A10 S0.00127 B0 ; configure blade probewhich indicates that your probe is connected to pin io1.in on the EXP1HCL board at address 50. In the M122 responses that use address 0x41008000 the 9th word after the colon shows the input state of all pins of Port A. Pin io1.in is connected to Port A pin 13, so bit 13 of that word should show the state of the probe inputs. That's the bit worth 0x00002000. In your reports that word has values 089d3701, 0a953f01, 00953f01, 4a9d3f01 and 419d3f01. In all cases that bit is set, indicating that the input pin is high.
Is the probe still connected to pin io1.in of board 50?
Duet WiFi hardware designer and firmware engineer
Please do not ask me for Duet support via PM or email, use the forum
http://www.escher3d.com, https://miscsolutions.wordpress.com -
@dc42 Yes, It is still connected to the board 50 io1.in pin. inverted with pullup.
If I understand correctly that would indicate that the probing setup is not actually dragging the input pin down below the trigger point (i'd guess 1.65v, due to the trigger being set at 500 of 1000) at the moment the request is sent.Maybe I need to setup a scope on this probe input and confirm that it is in fact getting dragged down, and how that signal might look. If it's noisy when near the tube it might trigger before, or long after the initial touch on the tube.
I have been assuming that it has due to the blade being in contact with the tube, and the probe cycle completing,
-
@dc42 I left the machine in the stuck probe status, so I was able to retest, confirming with a multimeter that the probe was and was not triggered (3v and 0v)
5/9/2025, 9:58:11 AM: M118 P0 S{"Probe Stuck, Probe definitely not triggered "^sensors.probes[0].value[0]} L2 M122 B50 P1007 A{0x40002800} R16 M122 B50 P1007 A{0x41008000} R16: Probe Stuck, Probe definitely not triggered 1000

Address 0x40002800: 00000002 00000000 00000000 00002008 00002008 00000000 00000000 0000b000 00b00000 00000000 00000000 00000000 00000000 00000000 00000000 00000000
Address 0x41008000: c8040422 c8040422 c8040422 c8040422 00142401 00142401 00142401 00142401 00953701 00000000 00000000 00000000 01011100 00022022 88002022 07000066
5/9/2025, 9:59:03 AM: M118 P0 S{"Probe Stuck, Probe definitely Triggered"^sensors.probes[0].value[0]} L2 M122 B50 P1007 A{0x40002800} R16 M122 B50 P1007 A{0x41008000} R16: Probe Stuck, Probe definitely Triggered1000

Address 0x40002800: 00000002 00000000 00000000 00002008 00002008 00000000 00000000 0000b000 00b00000 00000000 00000000 00000000 00000000 00000000 00000000 00000000
Address 0x41008000: c8040422 c8040422 c8040422 c8040422 40142401 40142401 40142401 40142401 42951701 00000000 00000000 00000000 01011100 00022022 88002022 07000066
Then reset the sticky probe, and did the same. confirming the first time it's not triggered, and triggered the second, with a multimeter.
5/9/2025, 10:03:36 AM: M118 P0 S{"Probe Stuck, Probe definitely not Triggered"^sensors.probes[0].value[0]} L2 M122 B50 P1007 A{0x40002800} R16 M122 B50 P1007 A{0x41008000} R16: Probe Stuck, Probe definitely not Triggered0 Address 0x40002800: 00000002 00000000 00000000 00002008 00002008 00000000 00000000 0000b000 00b00000 00000000 00000000 00000000 00000000 00000000 00000000 00000000 Address 0x41008000: c8040422 c8040422 c8040422 c8040422 00142401 00142401 00142401 00142401 02953701 00000000 00000000 00000000 01011100 00022022 88002022 07000066 5/9/2025, 10:04:04 AM: M118 P0 S{"Probe Stuck, Probe definitely Triggered"^sensors.probes[0].value[0]} L2 M122 B50 P1007 A{0x40002800} R16 M122 B50 P1007 A{0x41008000} R16: Probe Stuck, Probe definitely Triggered1000 Address 0x40002800: 00000002 00000000 00000000 00002008 00002008 00000000 00000000 0000b000 00b00000 00000000 00000000 00000000 00000000 00000000 00000000 00000000 Address 0x41008000: c8040422 c8040422 c8040422 c8040422 00142401 00142401 00142401 00142401 009d1f01 00000000 00000000 00000000 01011100 00022022 88002022 07000066 -
@ironhydroxide said in [3.6.0-rc.3] sticky probe with 1HCL board:
Yes, It is still connected to the board 50 io1.in pin. inverted with pullup.
Don't enable the pullup in the M558 command. There is a permanent pullup resistor on that pin. It has quite a high value, so you may wish to add an external pullup to +3.3V or +5V. Enabling the internal pullup as well reduces the noise immunity because of the series resistor on the board.
The responses that you posted most recently look better, the 5th digit changes between 1 and 3 depending on whether the probe is triggered or not.
Duet WiFi hardware designer and firmware engineer
Please do not ask me for Duet support via PM or email, use the forum
http://www.escher3d.com, https://miscsolutions.wordpress.com -
@dc42 said in [3.6.0-rc.3] sticky probe with 1HCL board:
Don't enable the pullup in the M558 command. There is a permanent pullup resistor on that pin.
AH, good to know.
In the full run I see that hex digit swap between 1 and 3, but it's more often 3 than 1 (should alternate if it is working 100% of the time correctly).
I'll drop the pullup and do some more tests. -
@ironhydroxide please can you run one further test and post the responses:
- Get the probe into the "stuck" state (make quite sure that it really is stuck)
- Send
m122 b50 p1007 a{0x40002800} R16as before - Send
m122 b50 p1007 a{0x4000280c} v{0x00002000} - Change the state of the input (it doesn't matter if you change it more than once)
- Send
m122 b50 p1007 a{0x40002800} R16as before
Duet WiFi hardware designer and firmware engineer
Please do not ask me for Duet support via PM or email, use the forum
http://www.escher3d.com, https://miscsolutions.wordpress.com -
@dc42 Here's the output of those.
Step2 didn't give me an output... is that what was intended?from the console
5/12/2025, 8:04:01 AM: M118 P0 S{"Stuck Probe Confirmed"} L2: Stuck Probe Confirmed
5/12/2025, 8:04:08 AM: m122 b50 p1007 a{0x40002800} R16
5/12/2025, 8:04:09 AM: : Address 0x40002800: 00000002 00000000 00000000 00002008 00002008 00000000 00000000 0000b000 00b00000 00000000 00000000 00000000 00000000 00000000 00000000 00000000
5/12/2025, 8:04:30 AM: m122 b50 p1007 a{0x4000280c} v{0x00002000}
5/12/2025, 8:05:26 AM: M118 P0 S{"Before changing probe state"} L2 m122 b50 p1007 a{0x40002800} R16: Before changing probe state

Address 0x40002800: 00000002 00000000 00000000 00000008 00000008 00000000 00000000 0000b000 00b00000 00000000 00000000 00000000 00000000 00000000 00000000 00000000
5/12/2025, 8:06:14 AM: M118 P0 S{"After changing probe state"} L2 m122 b50 p1007 a{0x40002800} R16: After changing probe state

Address 0x40002800: 00000002 00000000 00000000 00000008 00000008 00002000 00000000 0000b000 00b00000 00000000 00000000 00000000 00000000 00000000 00000000 00000000
5/12/2025, 8:06:49 AM: M118 P0 S{"After changing probe 2nd time probe not triggered"} L2 m122 b50 p1007 a{0x40002800} R16: After changing probe 2nd time probe not triggered

Address 0x40002800: 00000002 00000000 00000000 00000008 00000008 00002000 00000000 0000b000 00b00000 00000000 00000000 00000000 00000000 00000000 00000000 00000000
5/12/2025, 8:07:18 AM: M118 P0 S{"After changing probe 3rd time probe triggered"} L2 m122 b50 p1007 a{0x40002800} R16: After changing probe 3rd time probe triggered

Address 0x40002800: 00000002 00000000 00000000 00000008 00000008 00002000 00000000 0000b000 00b00000 00000000 00000000 00000000 00000000 00000000 00000000 00000000
end of the eventlog
2025-05-12 08:04:00 [info] Stuck Probe Confirmed
2025-05-12 08:04:07 [debug] Address 0x40002800: 00000002 00000000 00000000 00002008 00002008 00000000 00000000 0000b000 00b00000 00000000 00000000 00000000 00000000 00000000 00000000 00000000
2025-05-12 08:05:25 [info] Before changing probe state
2025-05-12 08:05:25 [debug] Address 0x40002800: 00000002 00000000 00000000 00000008 00000008 00000000 00000000 0000b000 00b00000 00000000 00000000 00000000 00000000 00000000 00000000 00000000
2025-05-12 08:06:14 [info] After changing probe state
2025-05-12 08:06:14 [debug] Address 0x40002800: 00000002 00000000 00000000 00000008 00000008 00002000 00000000 0000b000 00b00000 00000000 00000000 00000000 00000000 00000000 00000000 00000000
2025-05-12 08:06:48 [info] After changing probe 2nd time probe not triggered
2025-05-12 08:06:48 [debug] Address 0x40002800: 00000002 00000000 00000000 00000008 00000008 00002000 00000000 0000b000 00b00000 00000000 00000000 00000000 00000000 00000000 00000000 00000000
2025-05-12 08:07:17 [info] After changing probe 3rd time probe triggered
2025-05-12 08:07:17 [debug] Address 0x40002800: 00000002 00000000 00000000 00000008 00000008 00002000 00000000 0000b000 00b00000 00000000 00000000 00000000 00000000 00000000 00000000 00000000
Full files here
eventlog.txt
eventlog.xlsx -
@ironhydroxide thanks. if you mean that step "3. Send m122 b50 p1007 a{0x4000280c} v{0x00002000}" didn't produce any output, that's expected.
Duet WiFi hardware designer and firmware engineer
Please do not ask me for Duet support via PM or email, use the forum
http://www.escher3d.com, https://miscsolutions.wordpress.com -
@dc42 doh, yeah, step 3
-
@ironhydroxide if you haven't reset the board yet please try sending this:
m122 b50 p1007 a{0x40002810} v{0x00002000}
and see whether the probe works after that, or is still stuck.
Duet WiFi hardware designer and firmware engineer
Please do not ask me for Duet support via PM or email, use the forum
http://www.escher3d.com, https://miscsolutions.wordpress.com