Well drawn explanation of the piezo sensitivity!
Sorry for necroing this thread, but your drawing inspired me to design a program that can generate a point cloud for probing, that avoids the points near the towers and prefers the points near the underbed piezo's.
Sadly it's made in Grasshopper so I can't share it as a script or executable, but maybe this could be inspiring to someone.
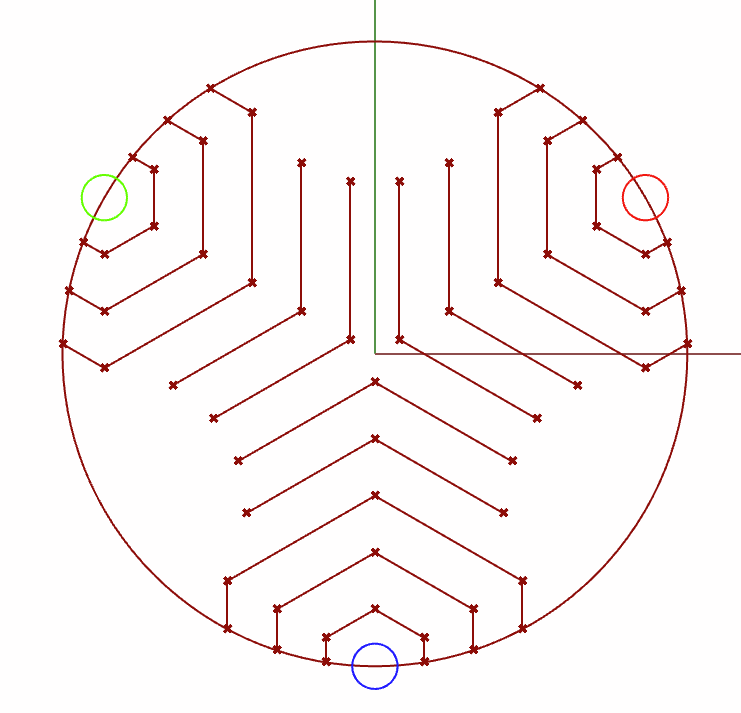
I just finished my DIY Delta printer today and I noticed that the probing wasn't that great across the bed so I wanted to see if I could fix that somehow. Assuming my bed is flat enough, I came up with this, where the colored circles are the piezo locations:
Example with lines drawn:

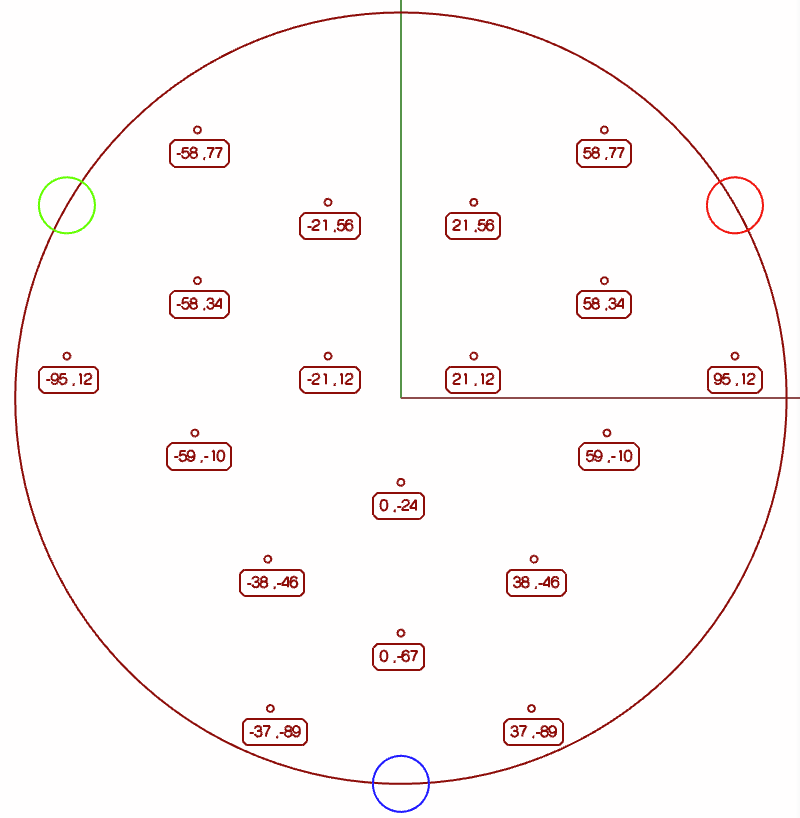
Outermost points culled and I tweaked the amount of points a little bit (and the point data is rounded to whole numbers):

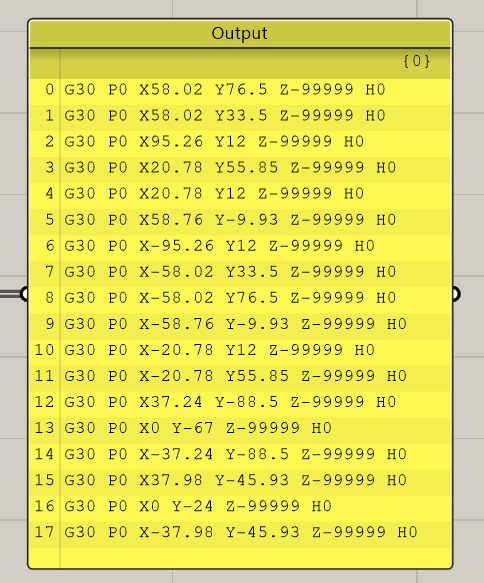
And this is the output point list that can now manually turned into a list for the reiterative probing sequence for example (with the point data rounded to two decimals):

This data can be changed on the fly, so I can see what the probing pattern will look like live without having to first run a script, it's live:
https://youtu.be/0ofXqwViaMc
I hope this could serve as an inspiration to someone and if you have ideas of a good type of point distribution I'd love to hear your ideas.
I have yet to try out this set of points but it's kinda late now so I'll do that tomorrow when I'm sharp and present again.
Just a small update on this reply, which I might turn into a post later on if anyone thinks it deserves its own post:
The results are in, initially it had quite a big deviation, but the second probing sequence was an immediate hit:
Calibrated 8 factors using 18 points, (mean, deviation) before (-0.009, 0.034) after (0.000, 0.022) Auto calibration successful, deviation 0.022mm
I also incorporated a point sorting algorithm. Before the point list was random, causing long travel times during probing, but now it's just moving from one point to the next closest point making this a painless probing sequence.
 But somehow I pulled through and managed to finish the build.